 TemplateAtlas
The TemplateAtlas catalog
Business & Finance Charts
In this collection
22 templates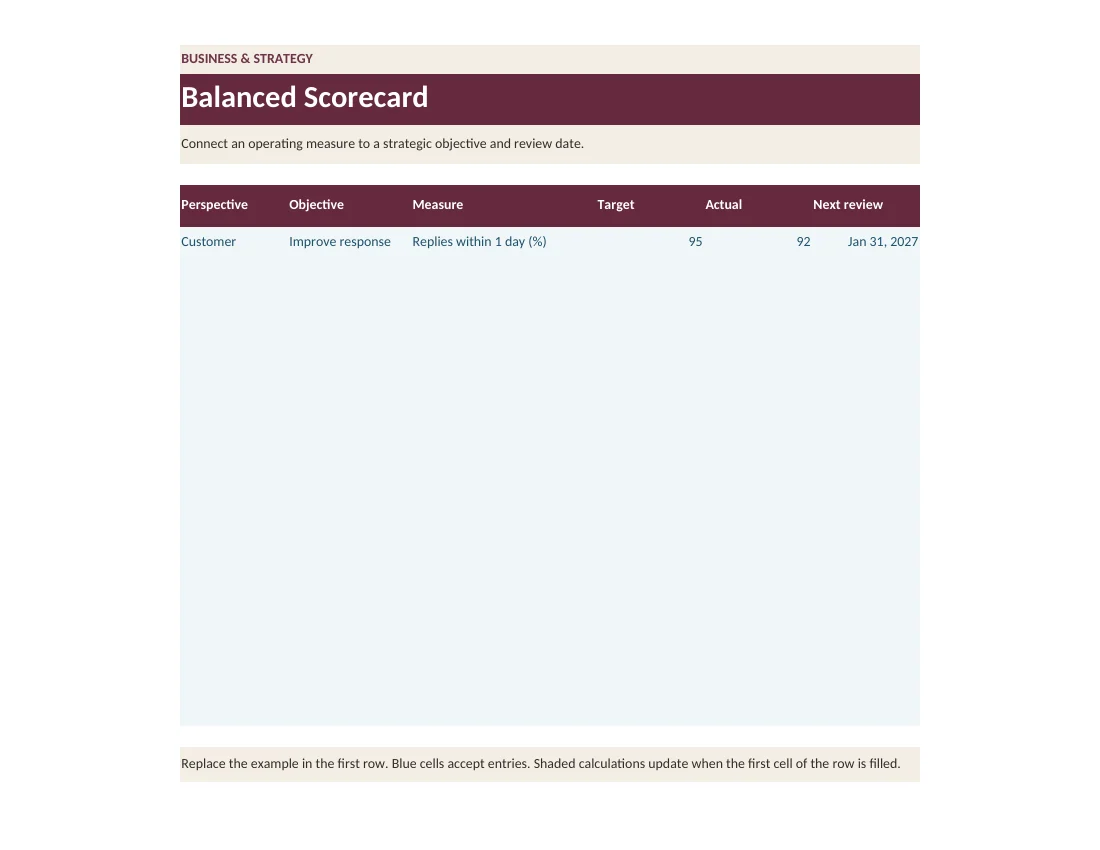
Balanced Scorecard
Connect an operating measure to a strategic objective and review date.
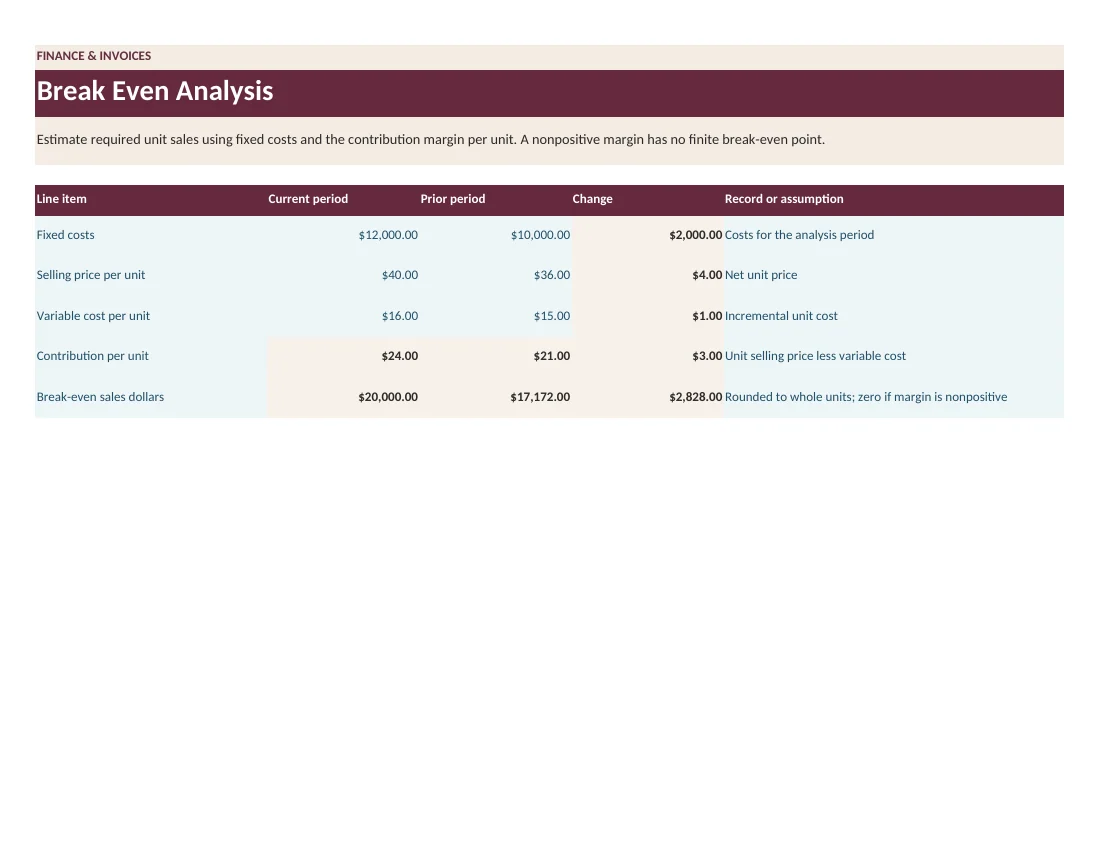
Break Even Analysis
Estimate required unit sales using fixed costs and the contribution margin per unit. A nonpositive margin has no finite break-even point.
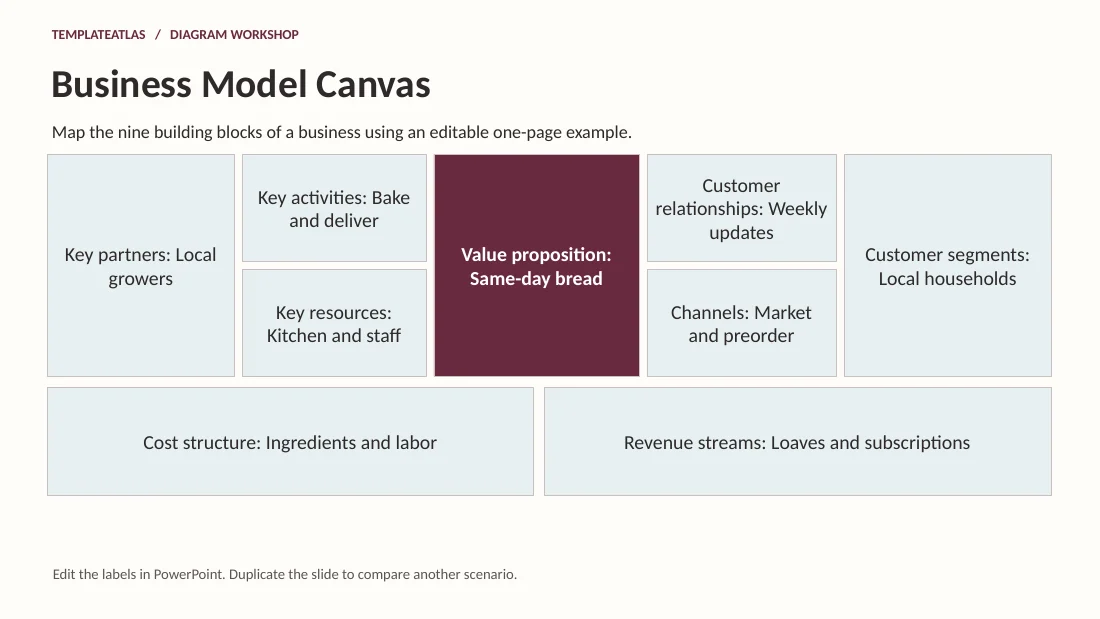
Business Model Canvas
Map the nine building blocks of a business using an editable one-page example.
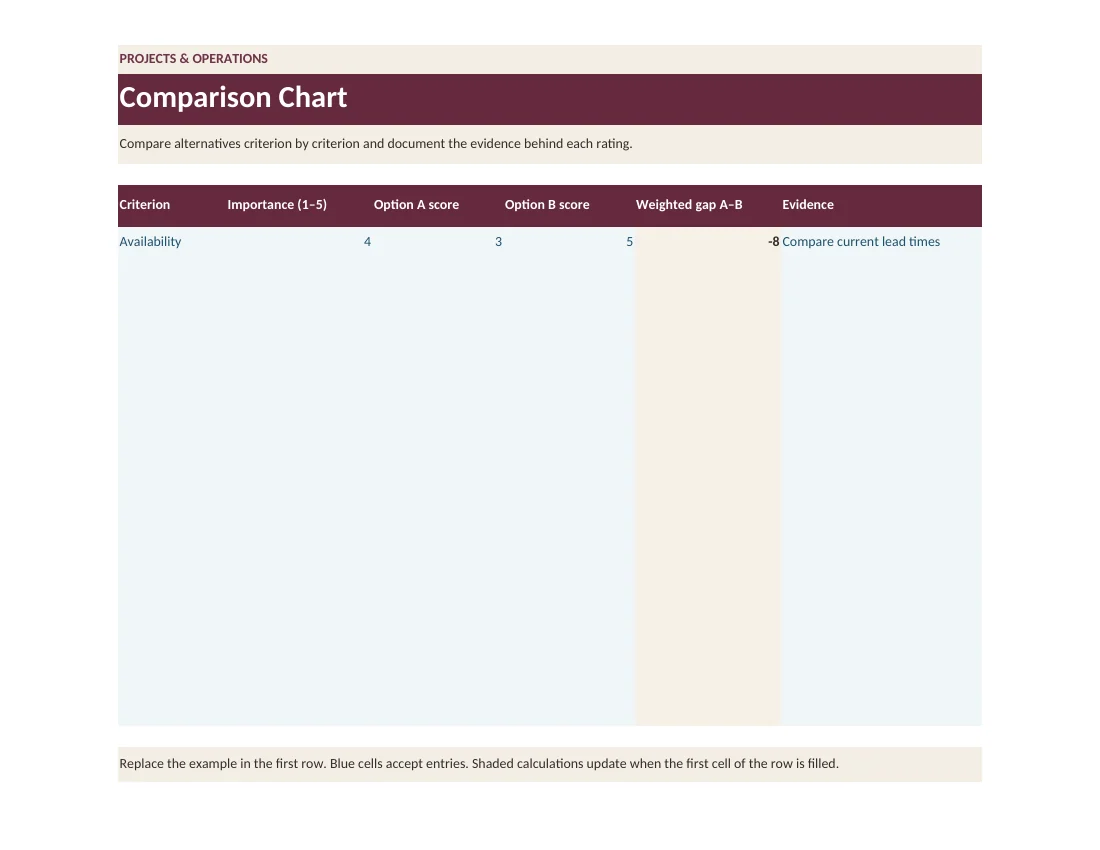
Comparison Chart
Compare alternatives criterion by criterion and document the evidence behind each rating.
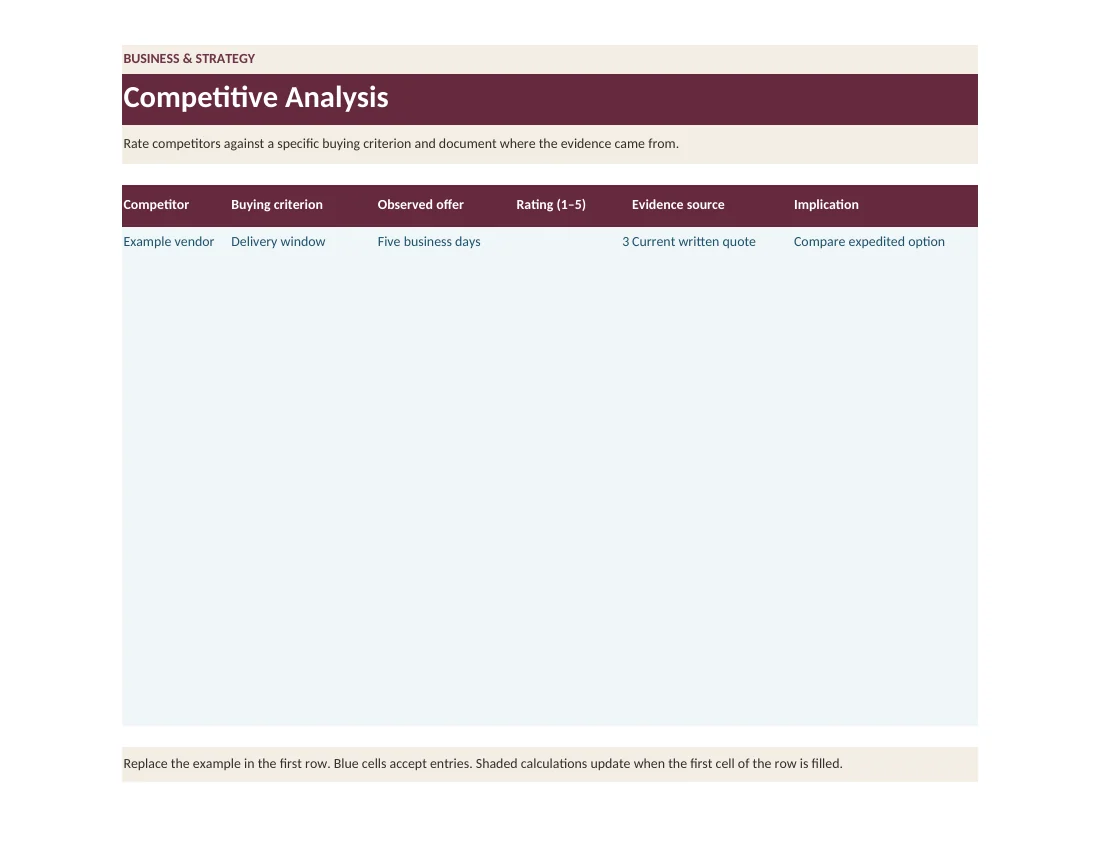
Competitive Analysis
Rate competitors against a specific buying criterion and document where the evidence came from.
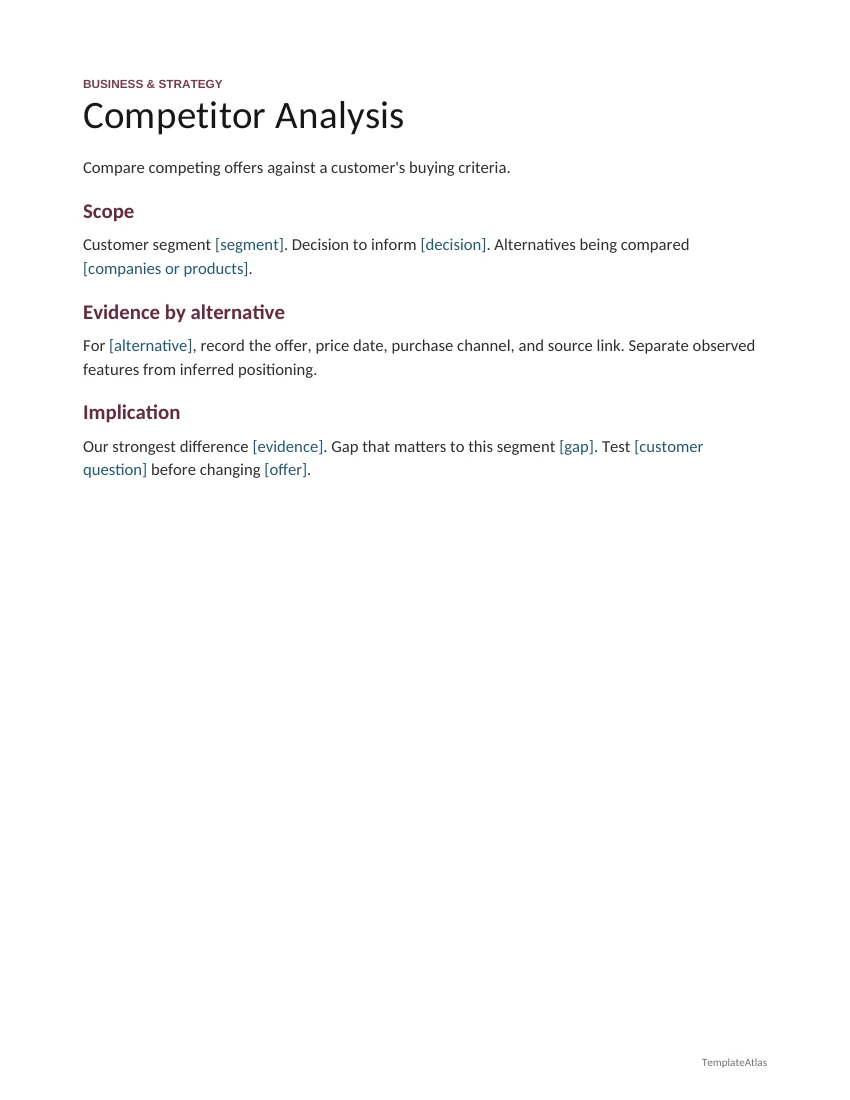
Competitor Analysis
Compare competing offers against a customer's buying criteria.
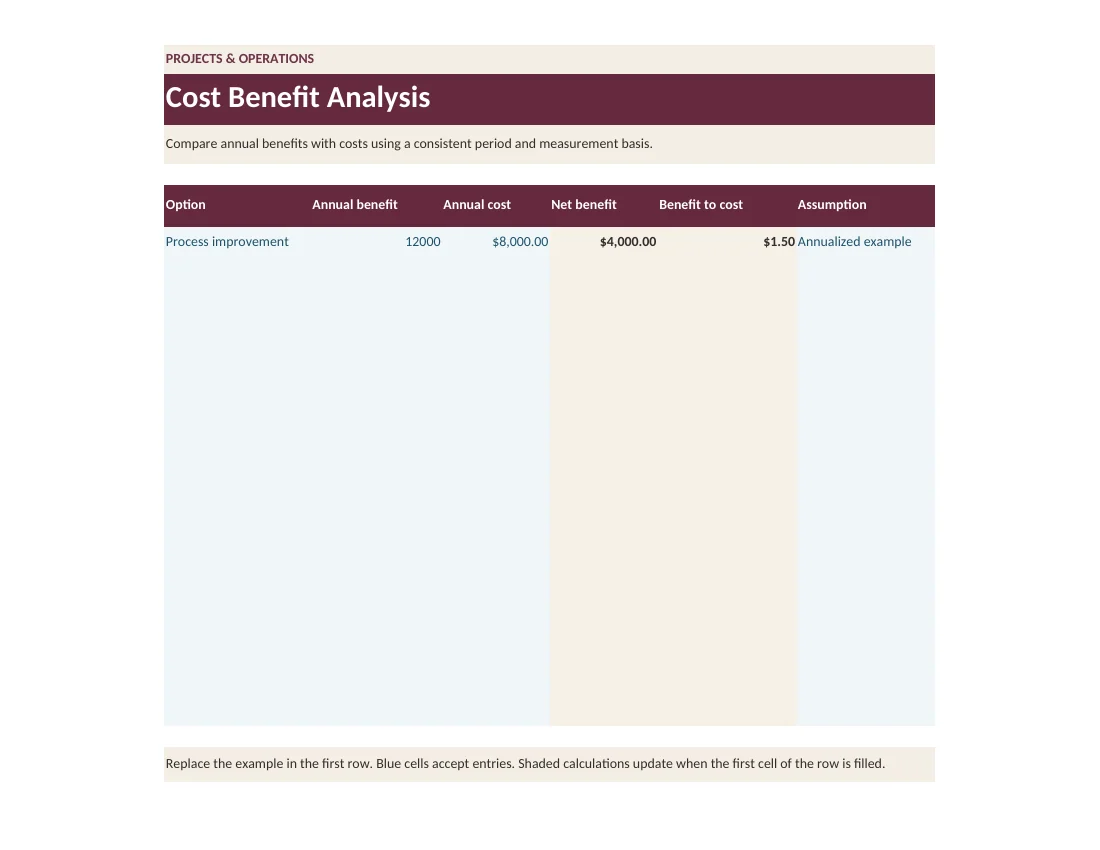
Cost Benefit Analysis
Compare annual benefits with costs using a consistent period and measurement basis.
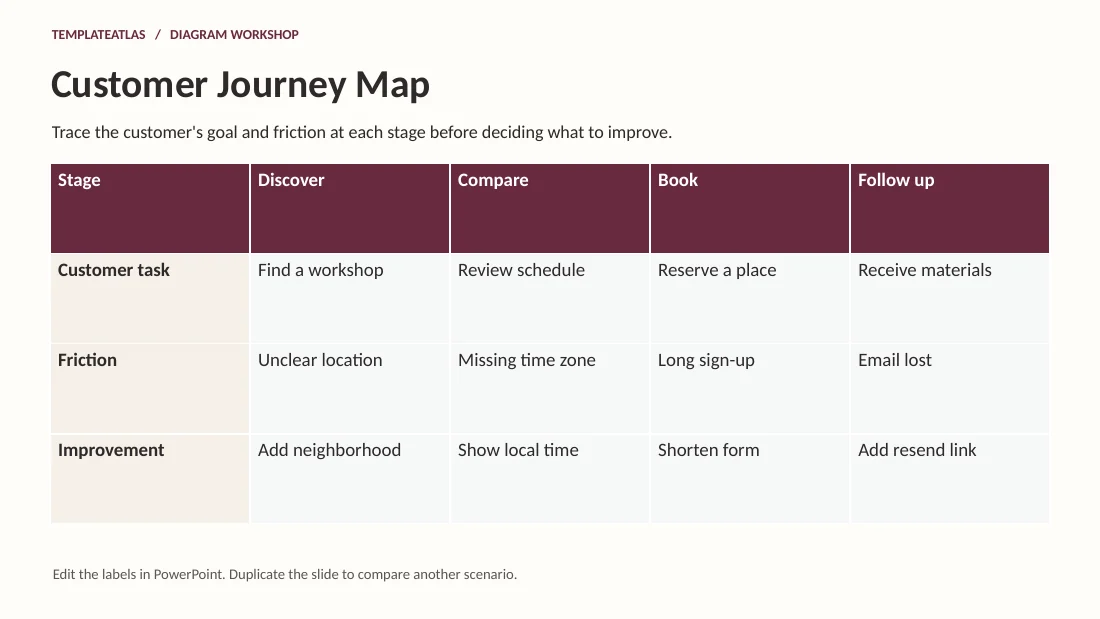
Customer Journey Map
Trace the customer's goal and friction at each stage before deciding what to improve.
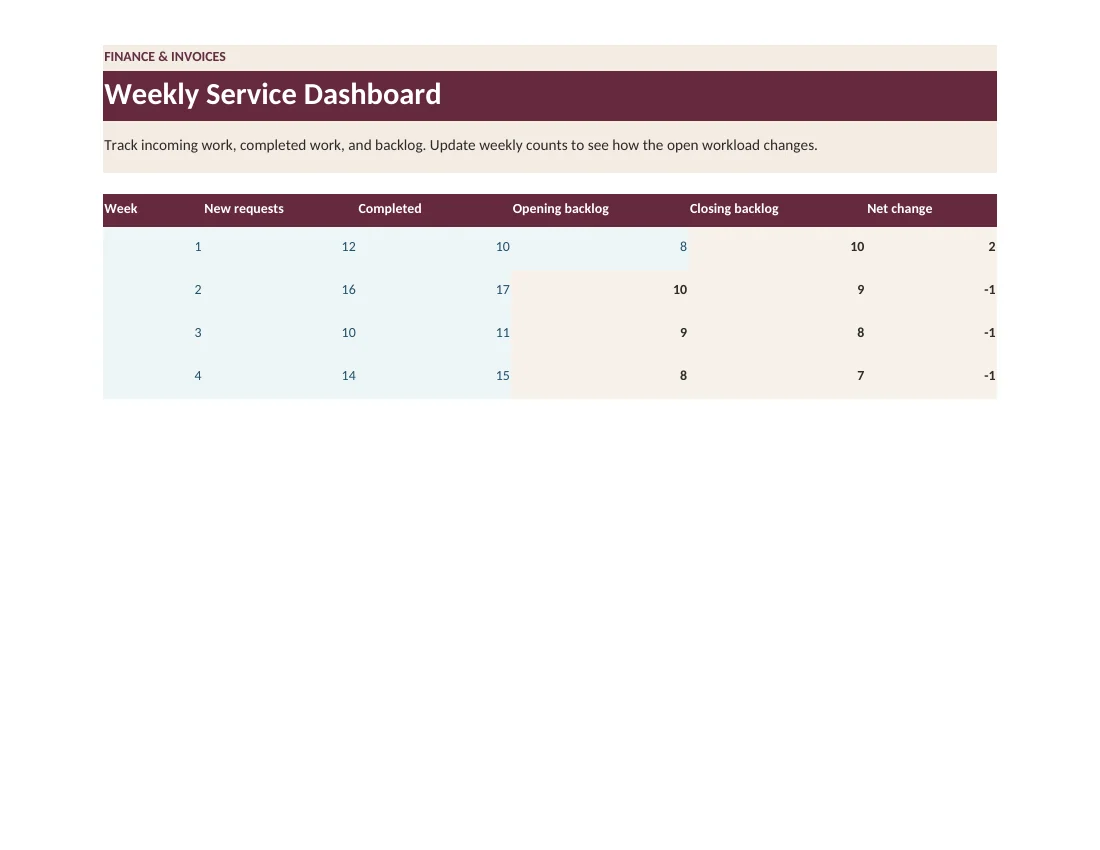
Weekly Service Dashboard
Track incoming work, completed work, and backlog. Update weekly counts to see how the open workload changes.
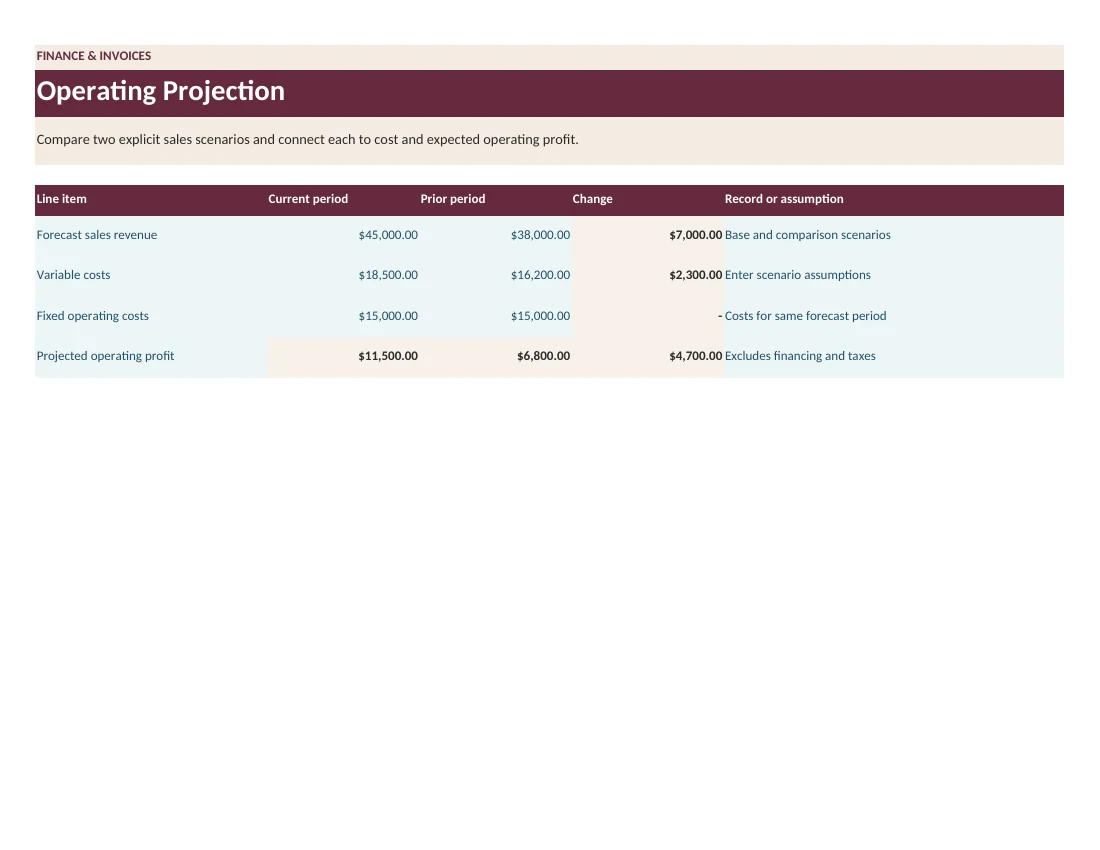
Operating Projection
Compare two explicit sales scenarios and connect each to cost and expected operating profit.
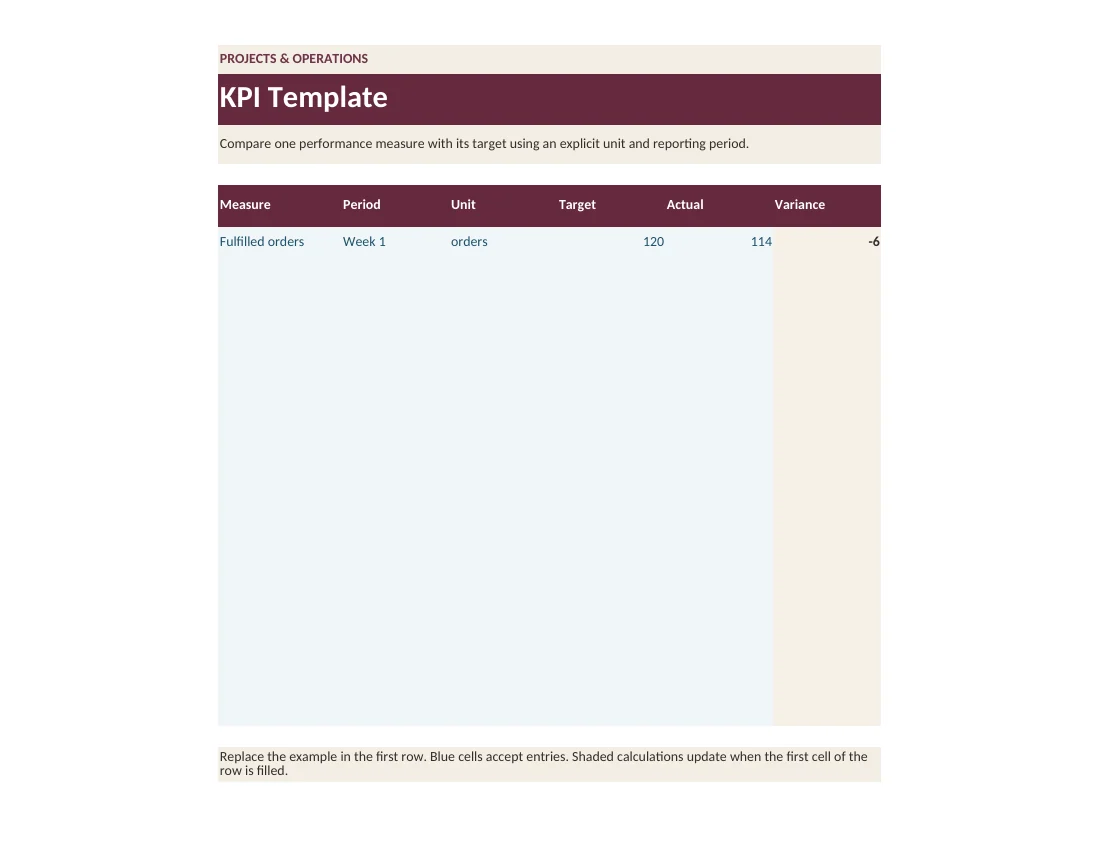
KPI Template
Compare one performance measure with its target using an explicit unit and reporting period.

Market Analysis
Assess a defined market without combining incompatible segments or periods.
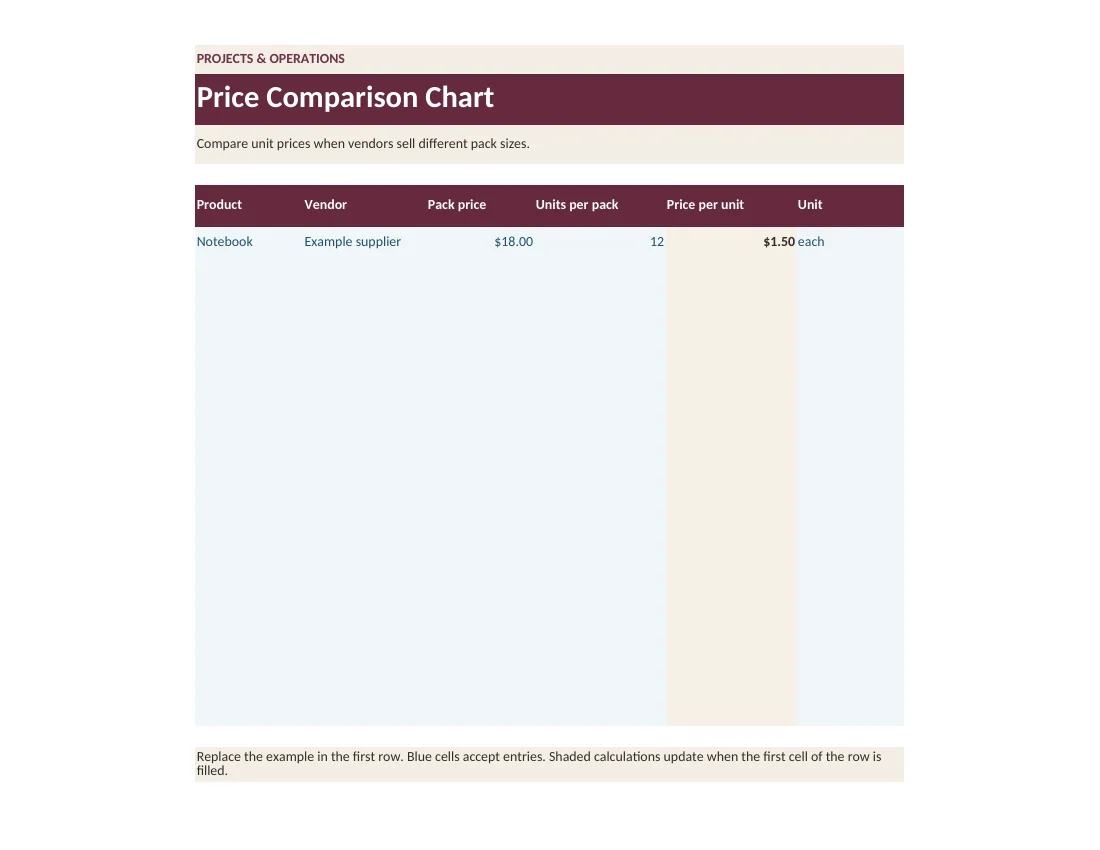
Price Comparison Chart
Compare unit prices when vendors sell different pack sizes.
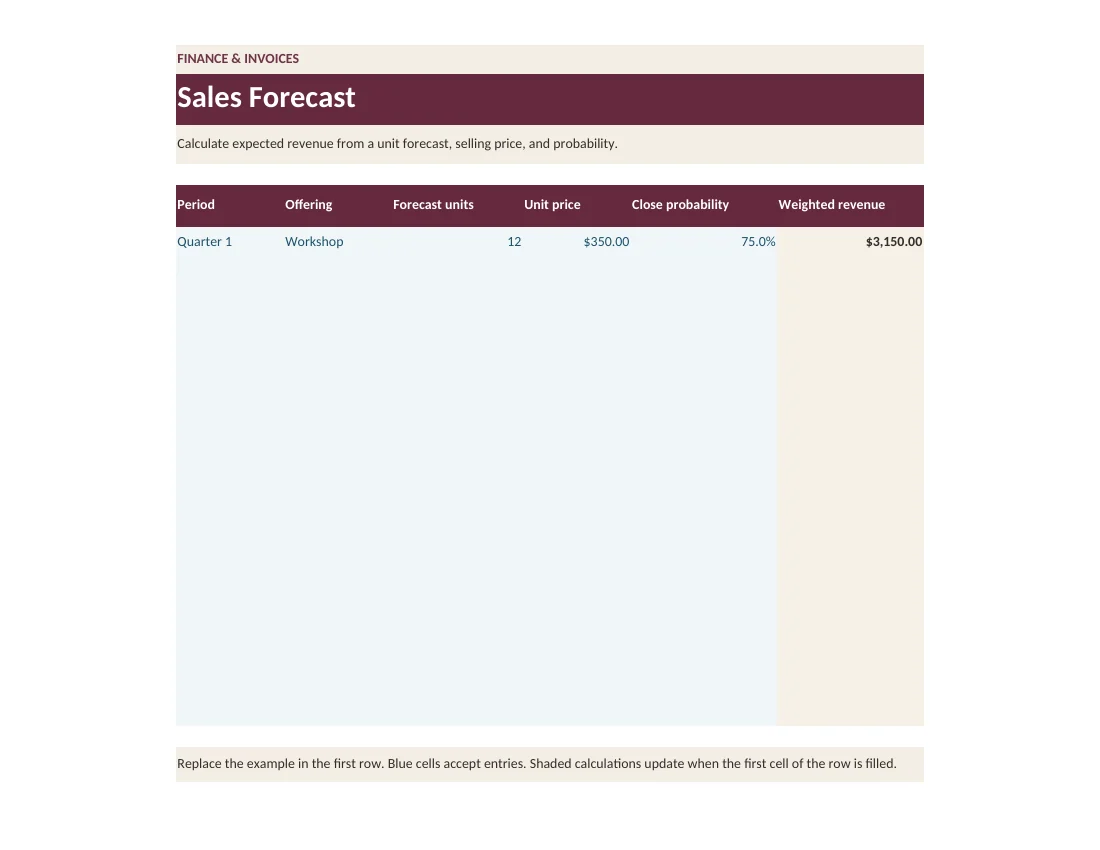
Sales Forecast
Calculate expected revenue from a unit forecast, selling price, and probability.
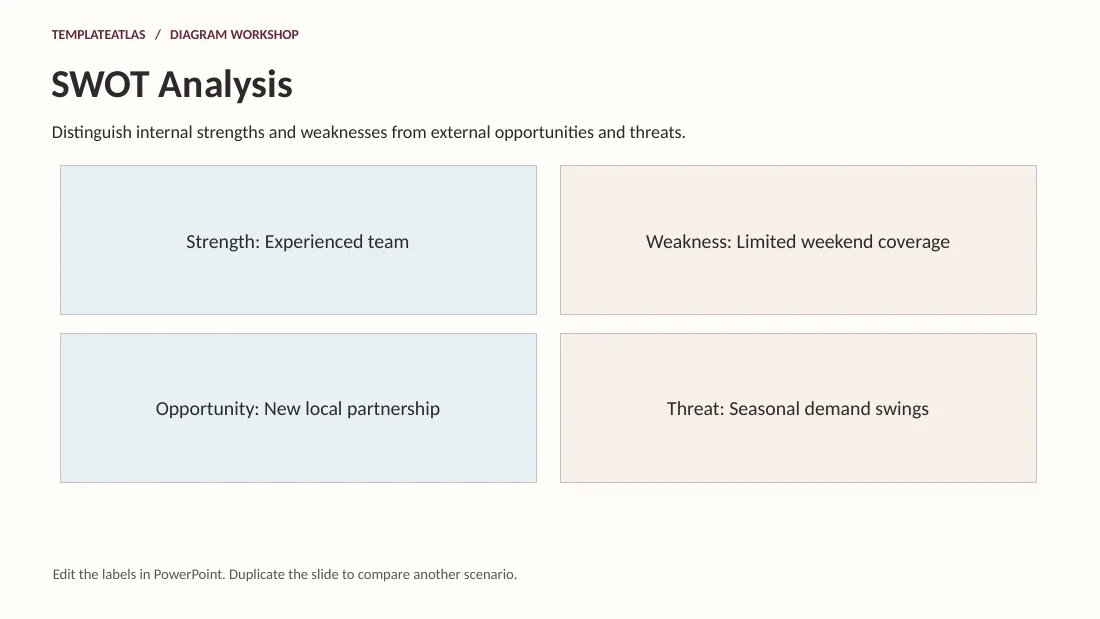
SWOT Analysis
Distinguish internal strengths and weaknesses from external opportunities and threats.
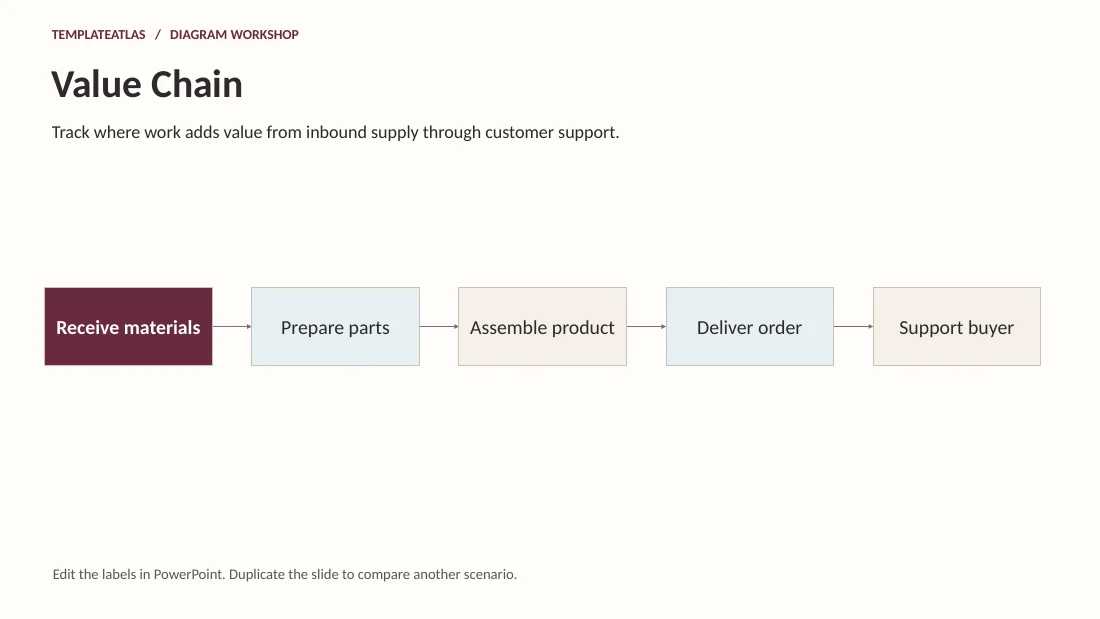
Value Chain
Track where work adds value from inbound supply through customer support.
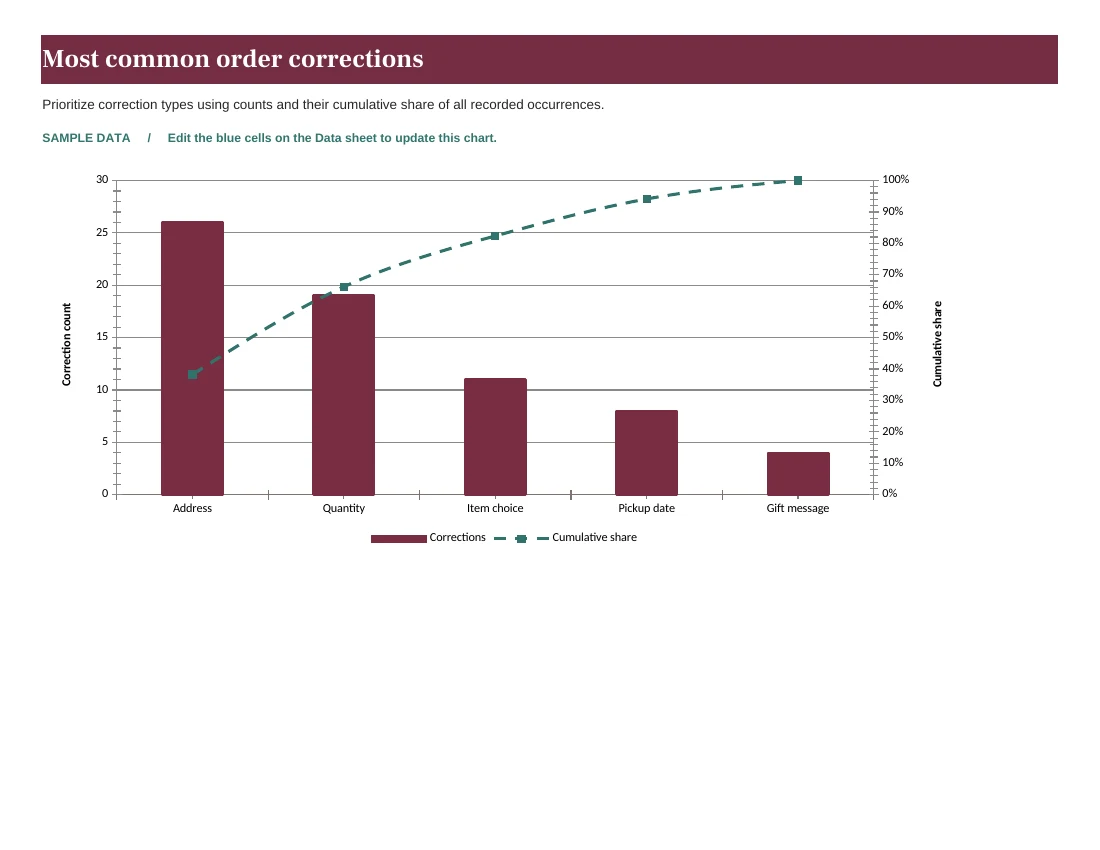
Most common order corrections
Prioritize correction types using counts and their cumulative share of all recorded occurrences.
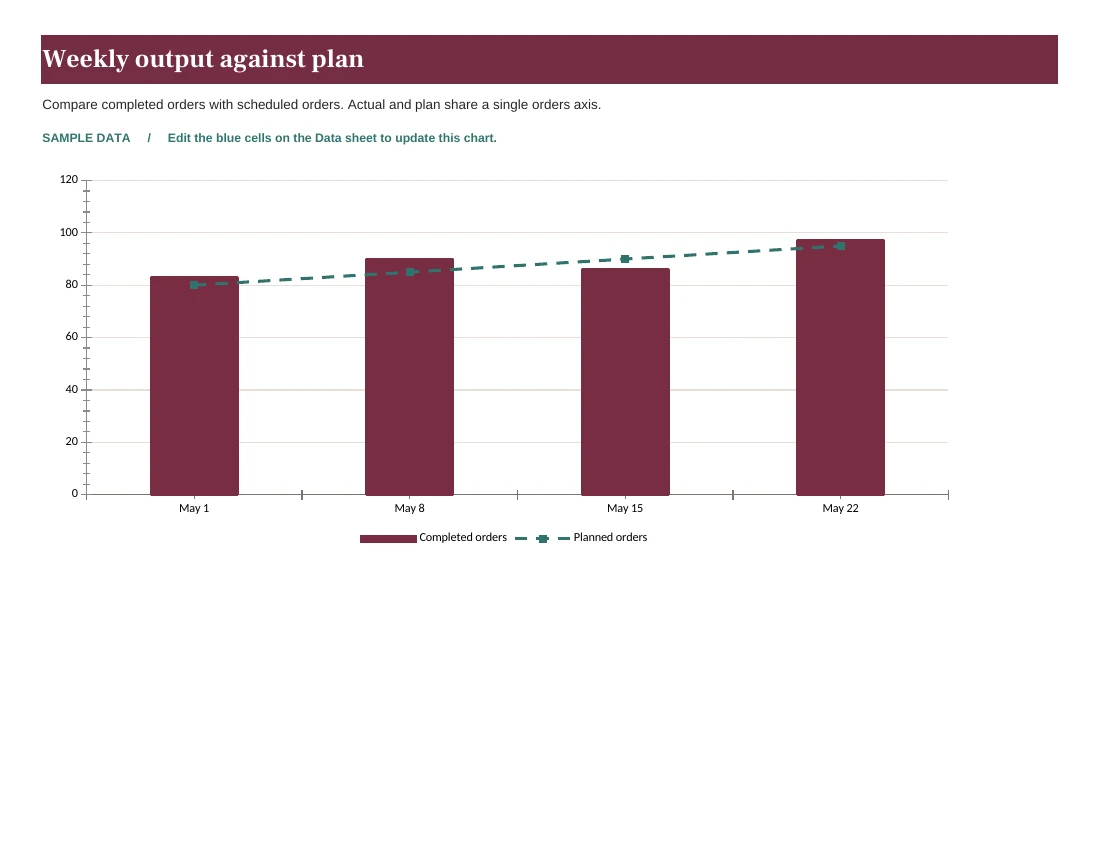
Weekly output against plan
Compare completed orders with scheduled orders. Actual and plan share a single orders axis.
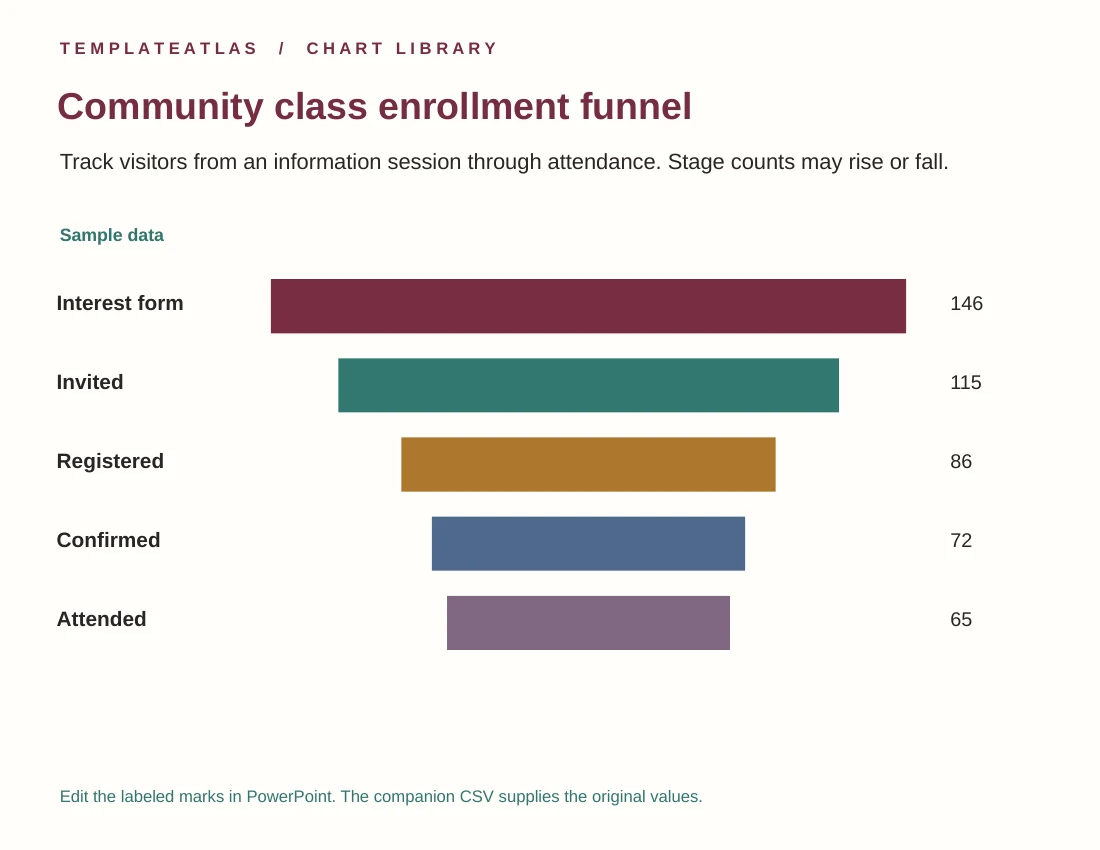
Community class enrollment funnel
Track visitors from an information session through attendance. Stage counts may rise or fall.
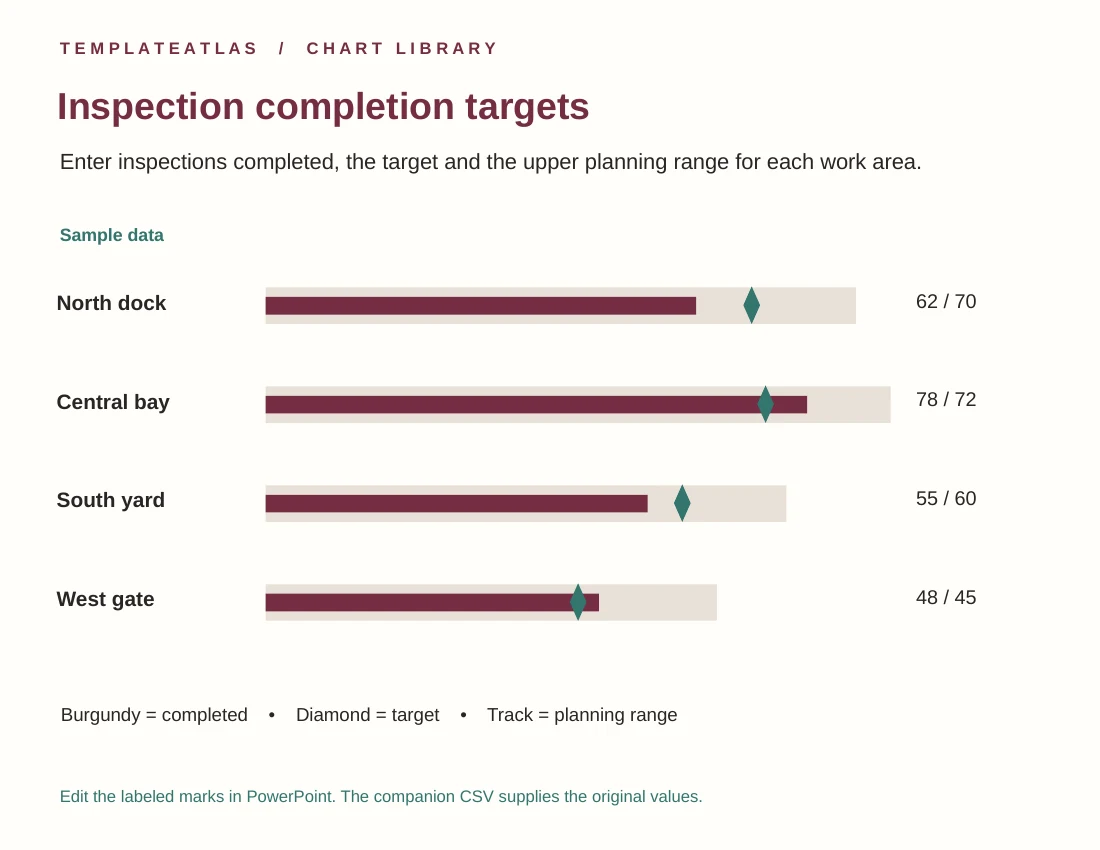
Inspection completion targets
Enter inspections completed, the target and the upper planning range for each work area.
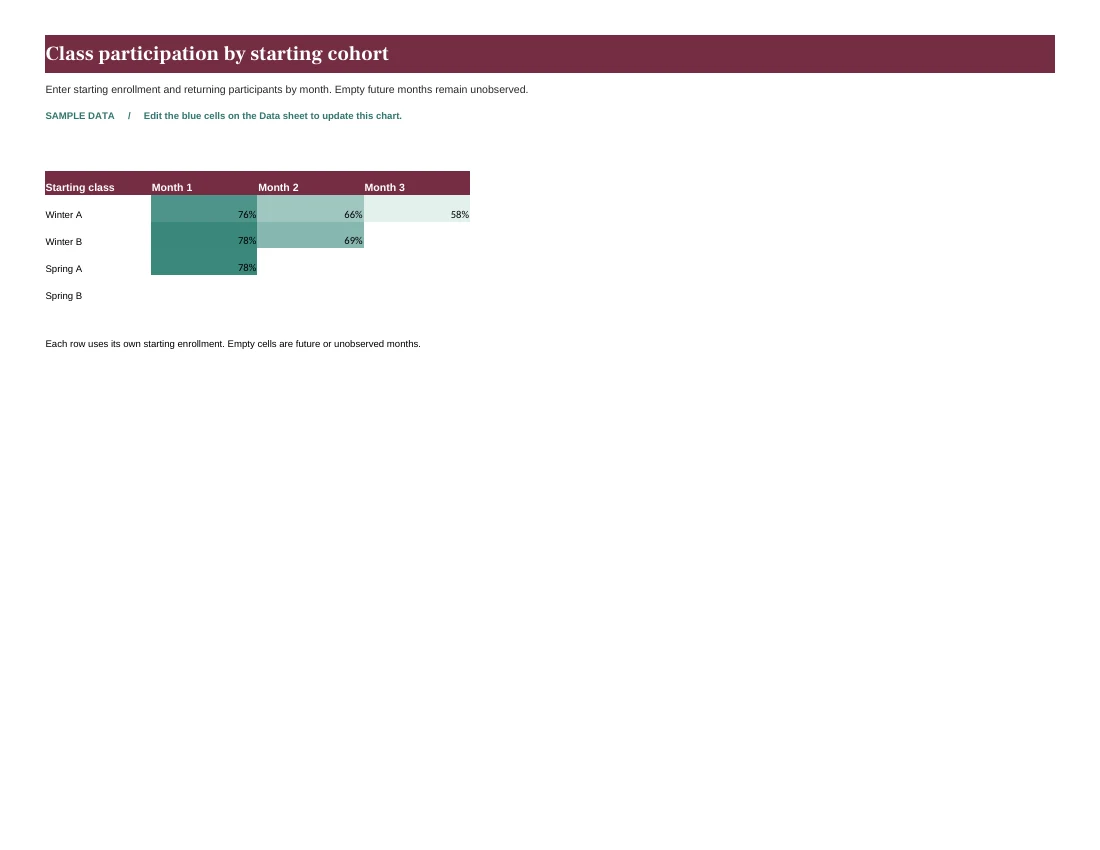
Class participation by starting cohort
Enter starting enrollment and returning participants by month. Empty future months remain unobserved.
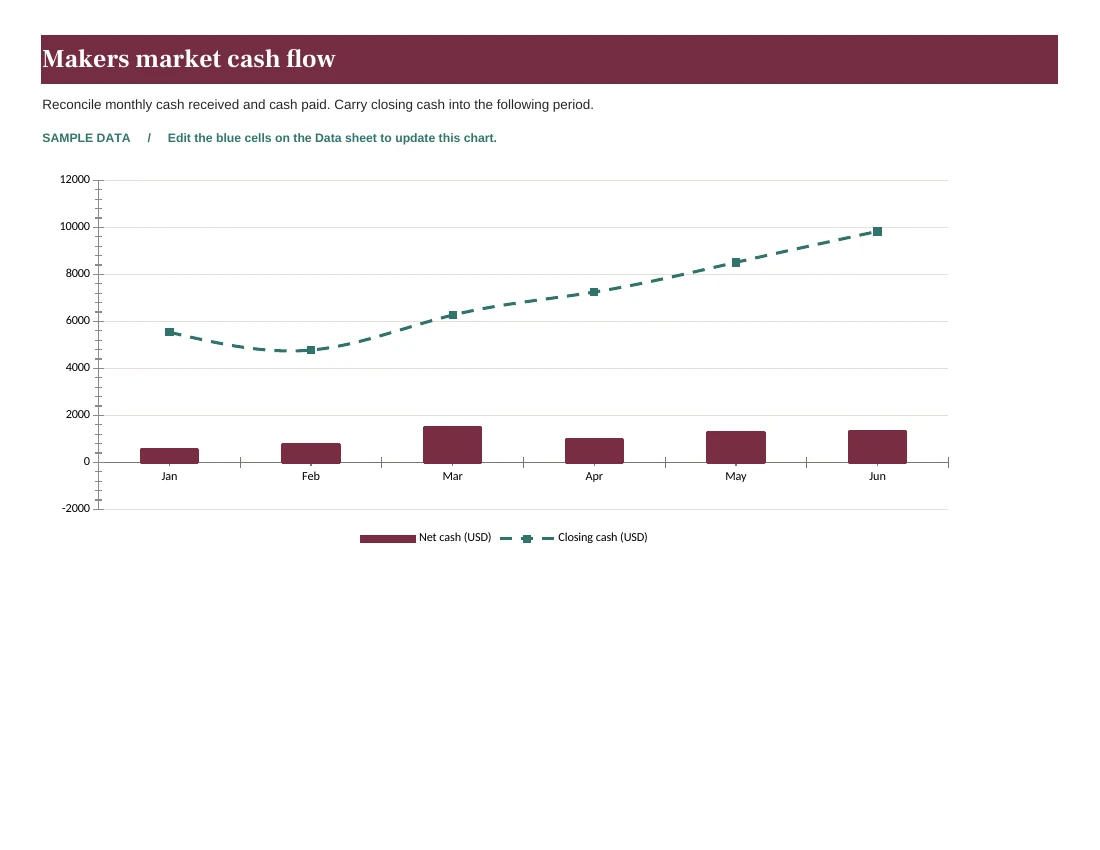
Makers market cash flow
Reconcile monthly cash received and cash paid. Carry closing cash into the following period.