 TemplateAtlas
The TemplateAtlas catalog
Data Visualization
In this collection
18 templates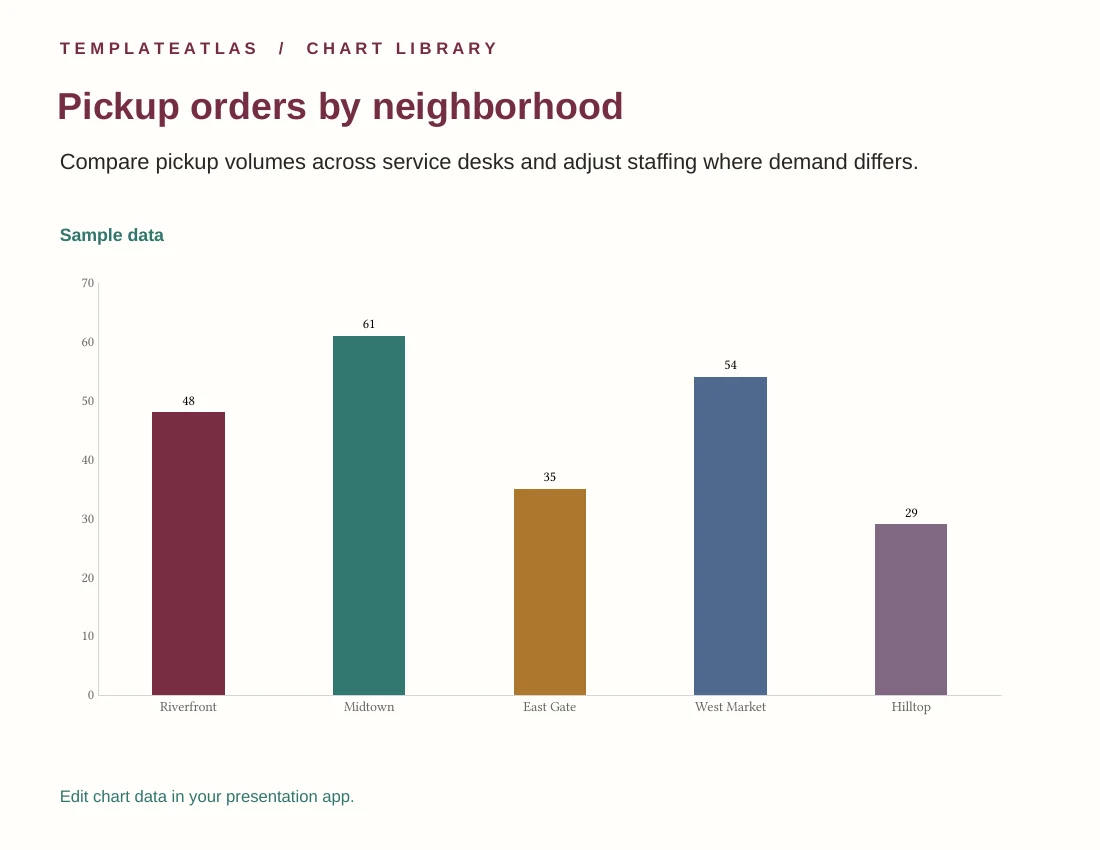
Pickup orders by neighborhood
Compare pickup volumes across service desks and adjust staffing where demand differs.
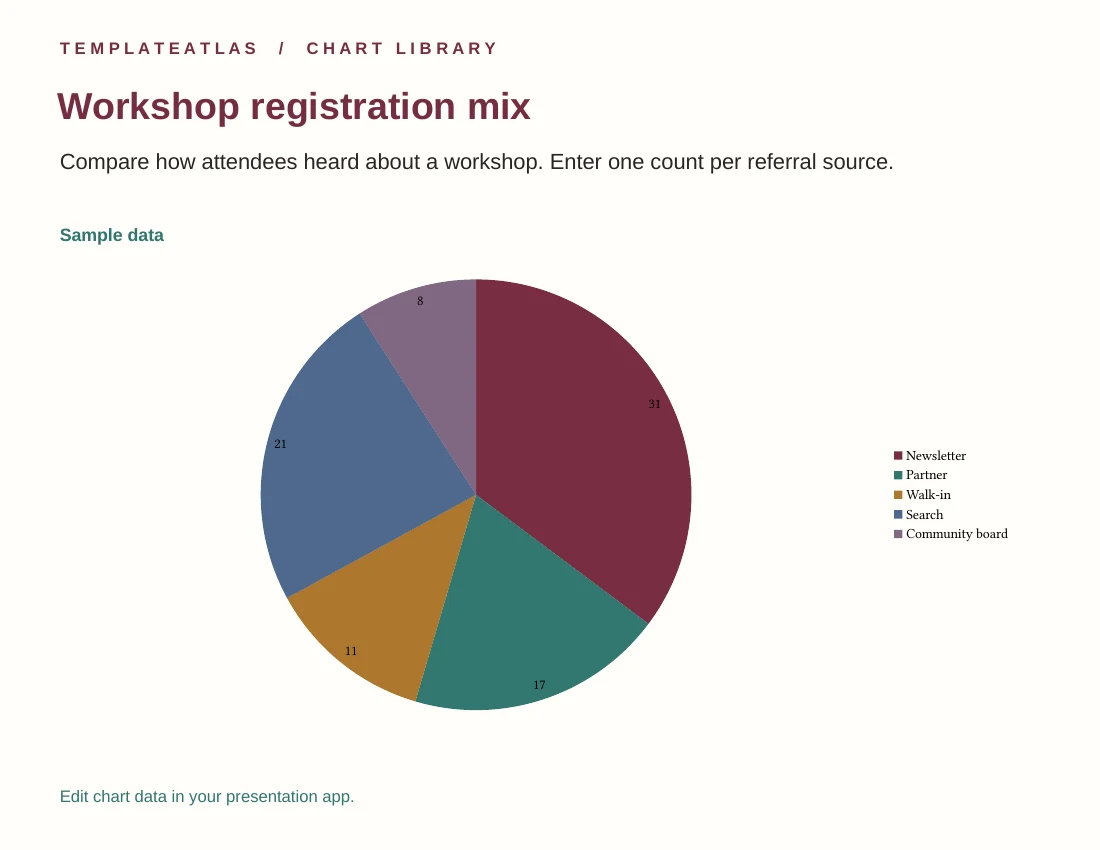
Workshop registration mix
Compare how attendees heard about a workshop. Enter one count per referral source.
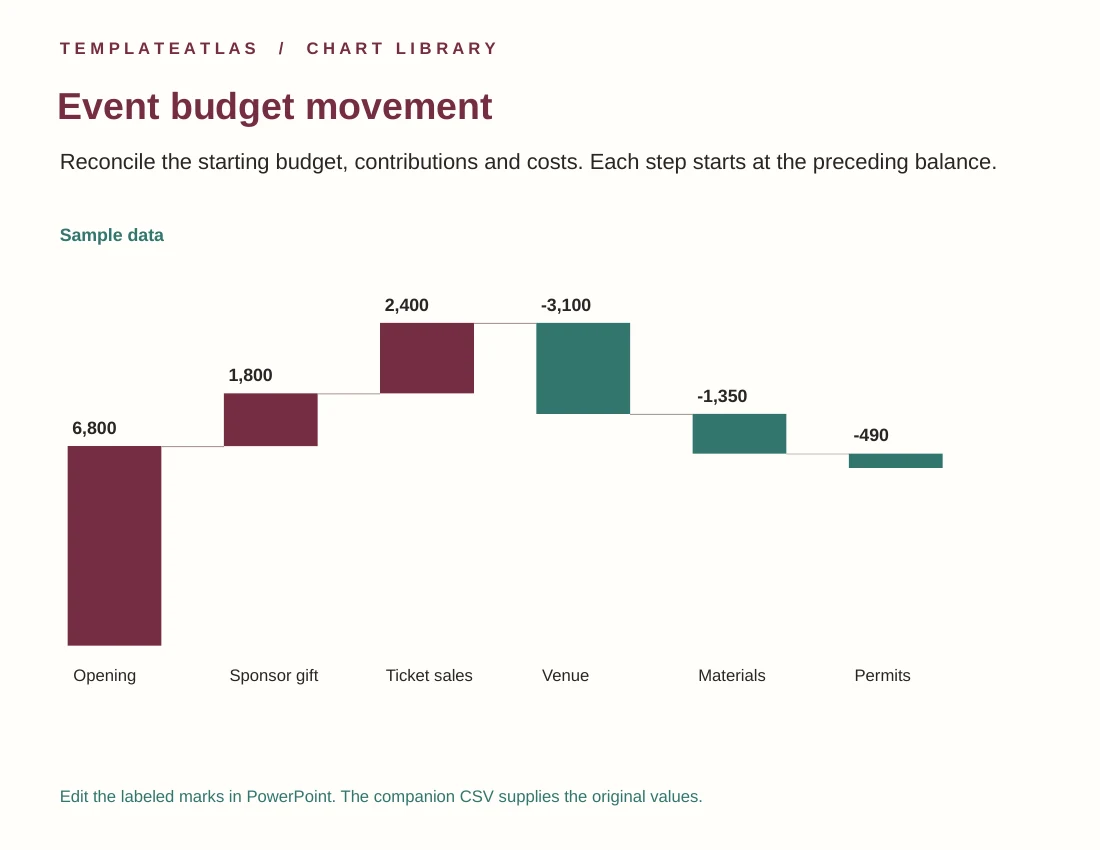
Event budget movement
Reconcile the starting budget, contributions and costs. Each step starts at the preceding balance.
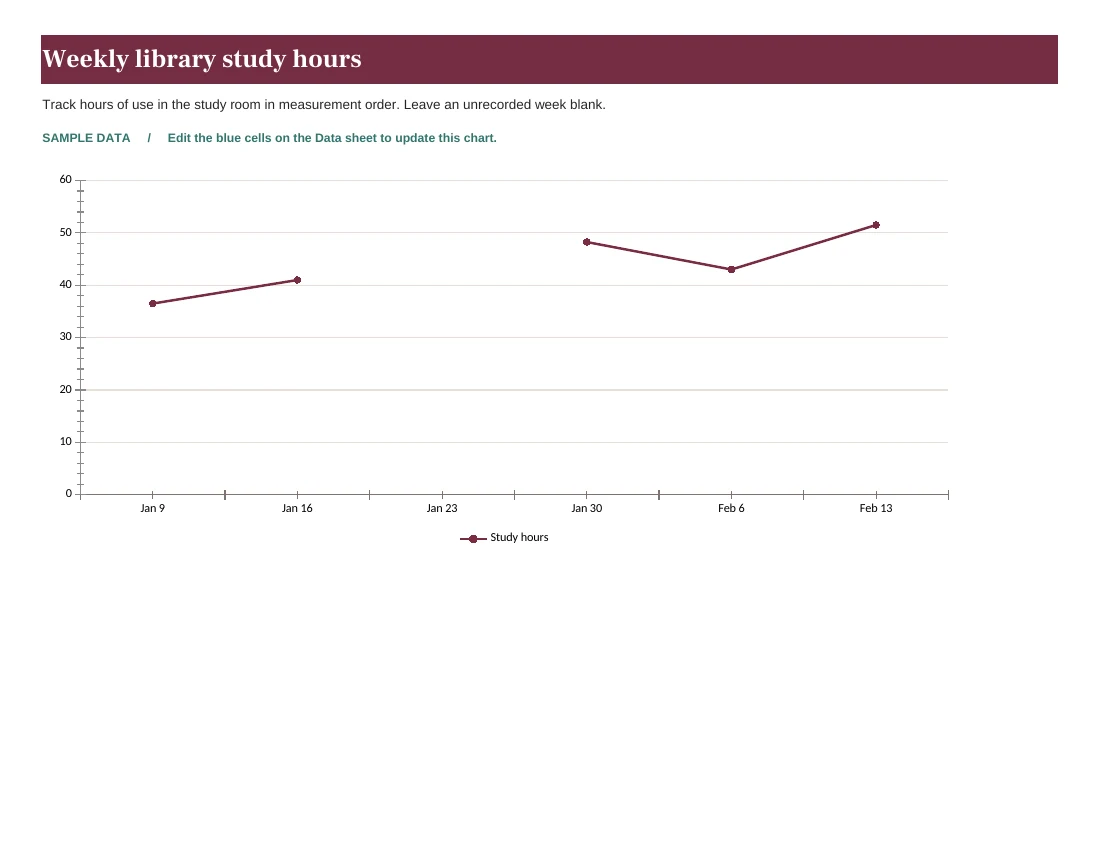
Weekly library study hours
Track hours of use in the study room in measurement order. Leave an unrecorded week blank.
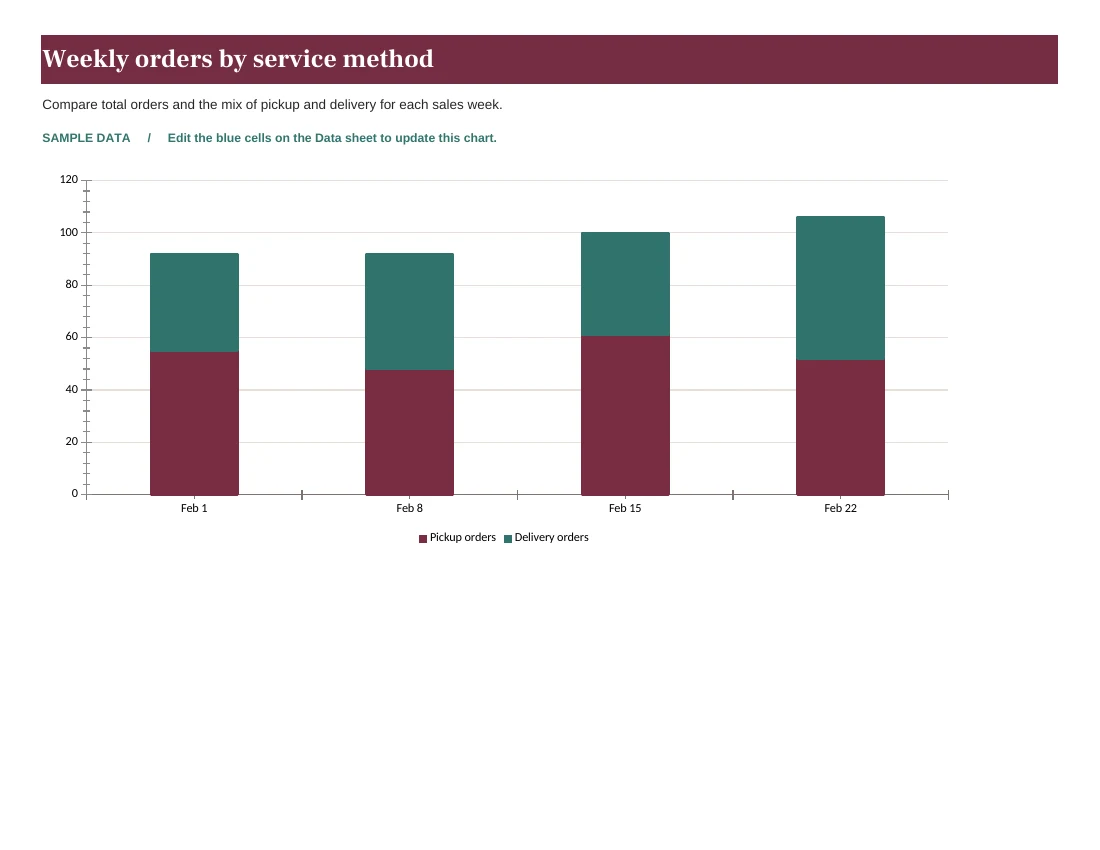
Weekly orders by service method
Compare total orders and the mix of pickup and delivery for each sales week.
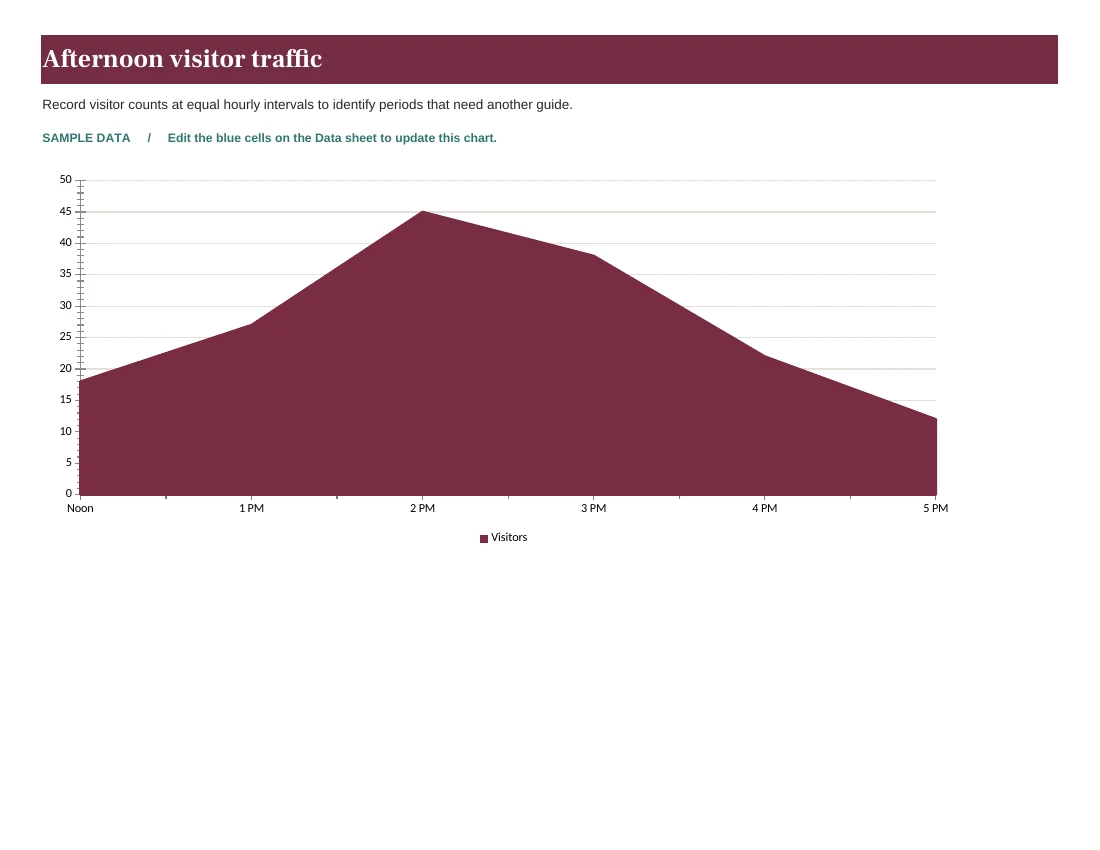
Afternoon visitor traffic
Record visitor counts at equal hourly intervals to identify periods that need another guide.
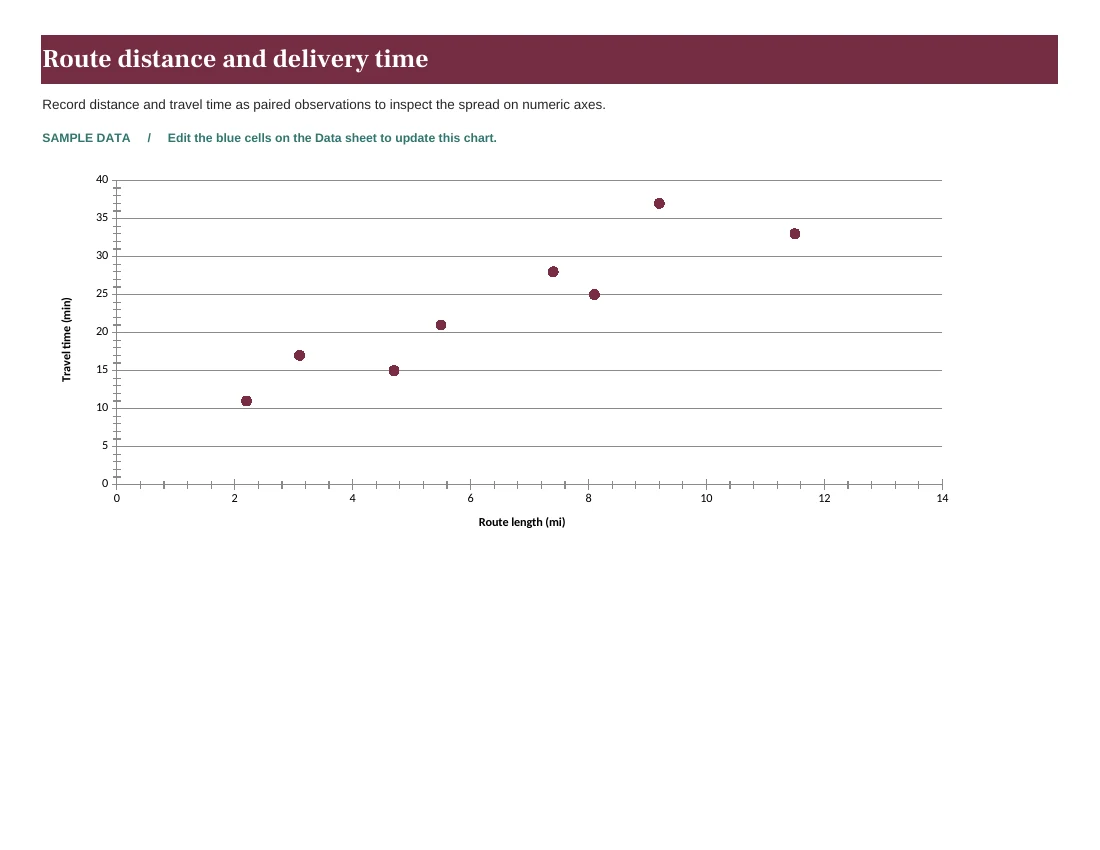
Route distance and delivery time
Record distance and travel time as paired observations to inspect the spread on numeric axes.
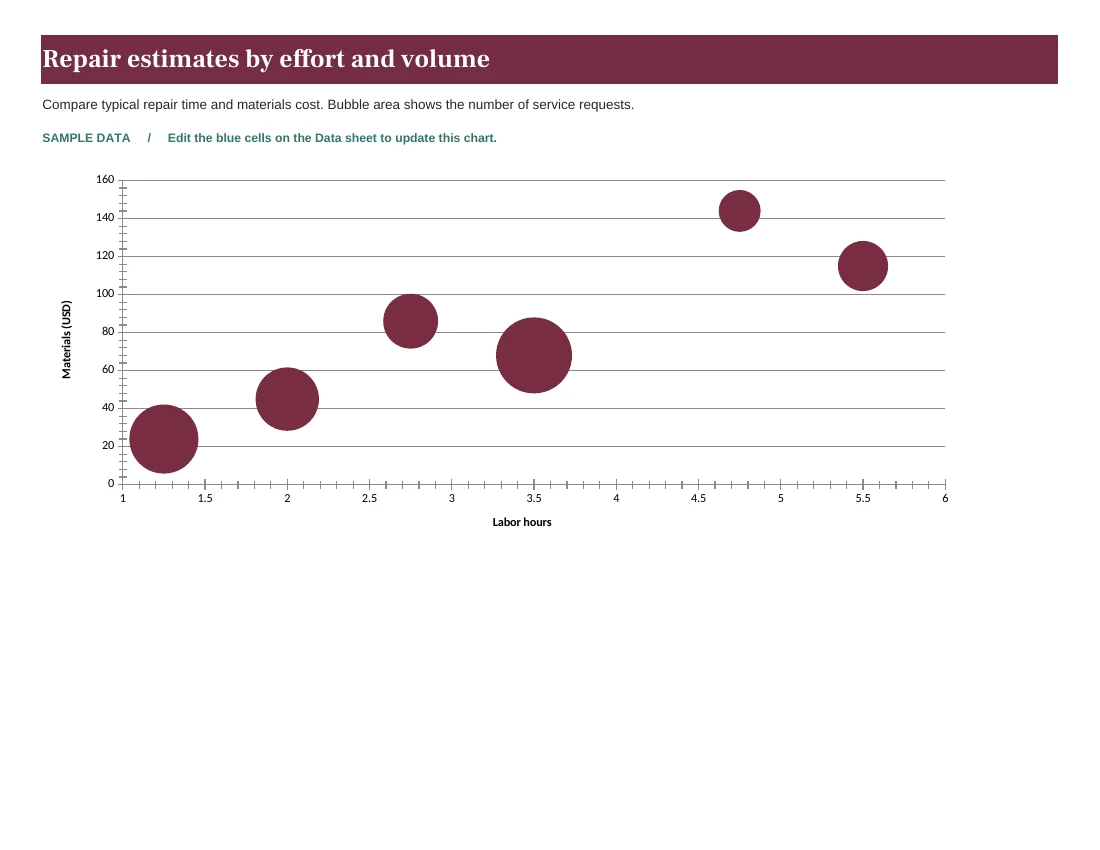
Repair estimates by effort and volume
Compare typical repair time and materials cost. Bubble area shows the number of service requests.
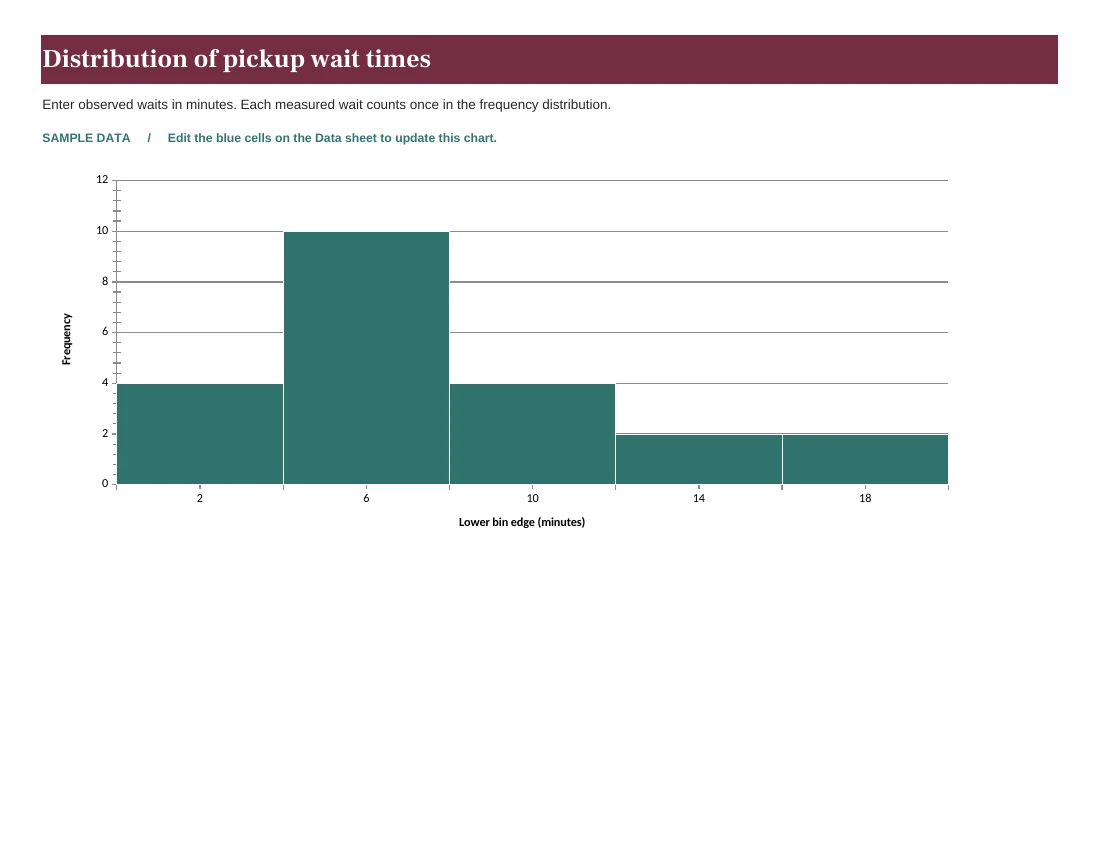
Distribution of pickup wait times
Enter observed waits in minutes. Each measured wait counts once in the frequency distribution.
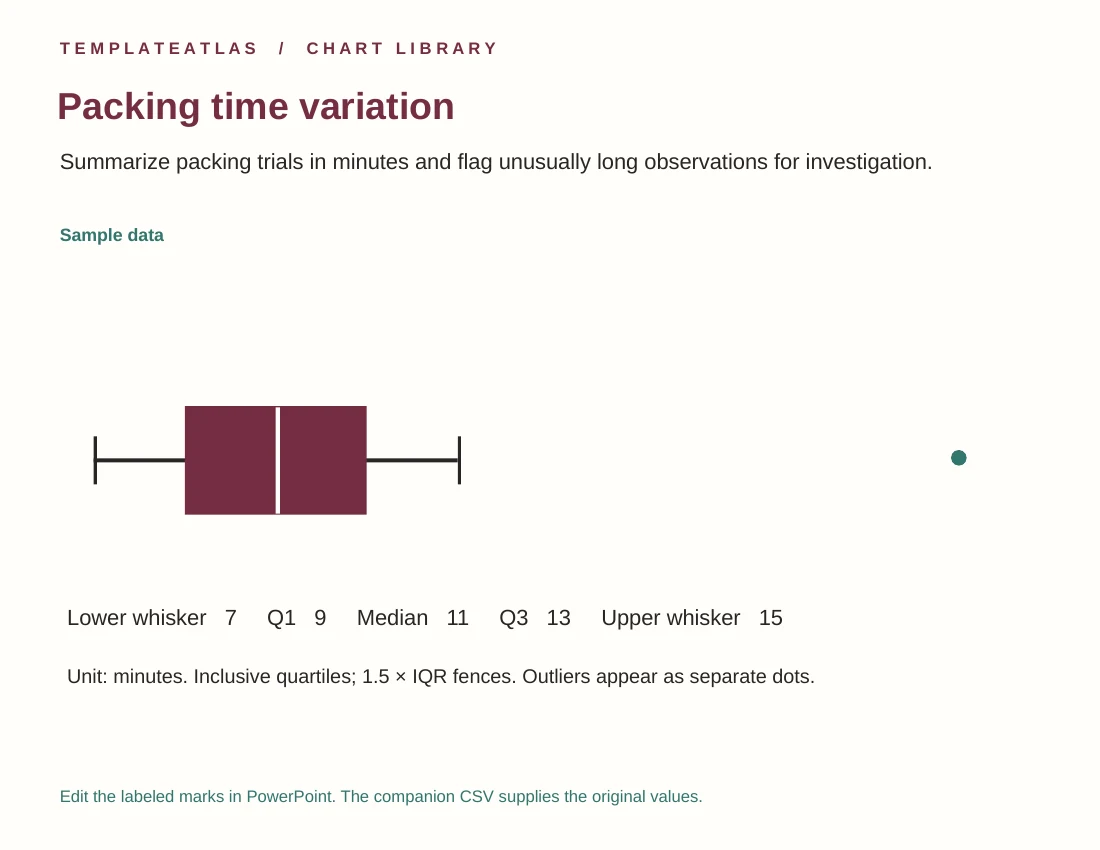
Packing time variation
Summarize packing trials in minutes and flag unusually long observations for investigation.
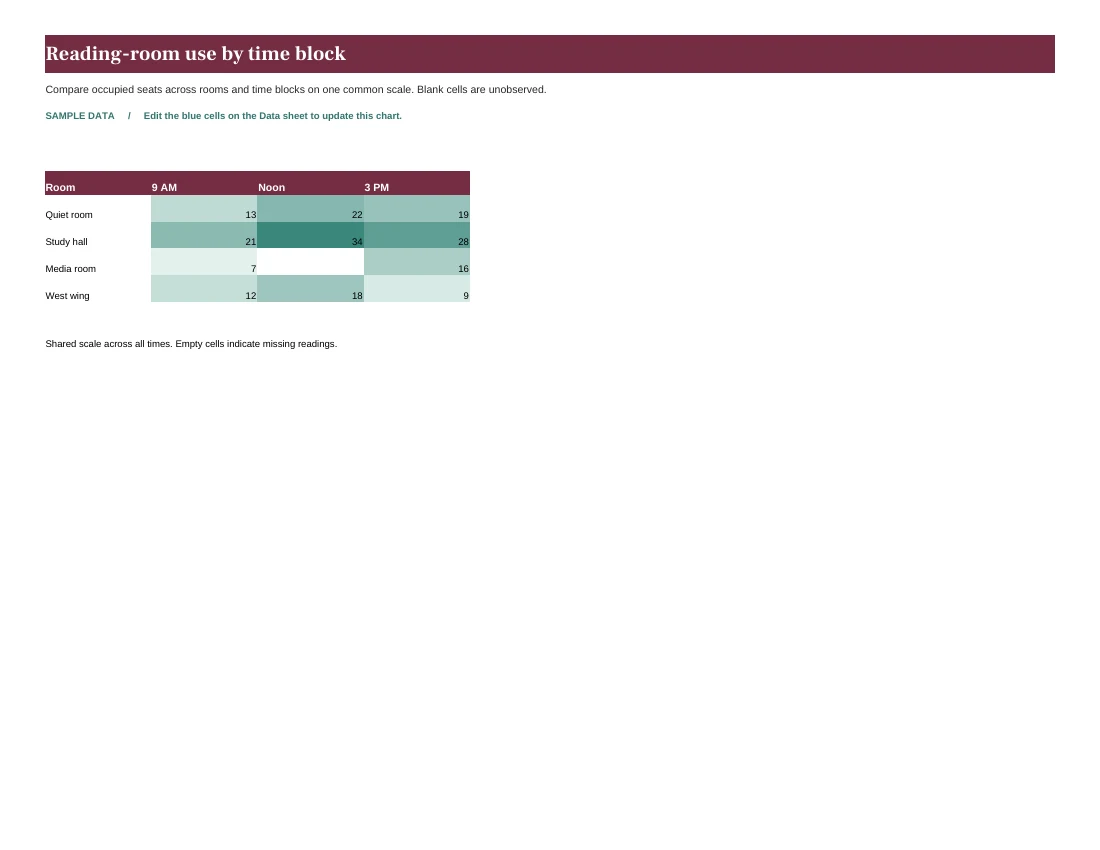
Reading-room use by time block
Compare occupied seats across rooms and time blocks on one common scale. Blank cells are unobserved.
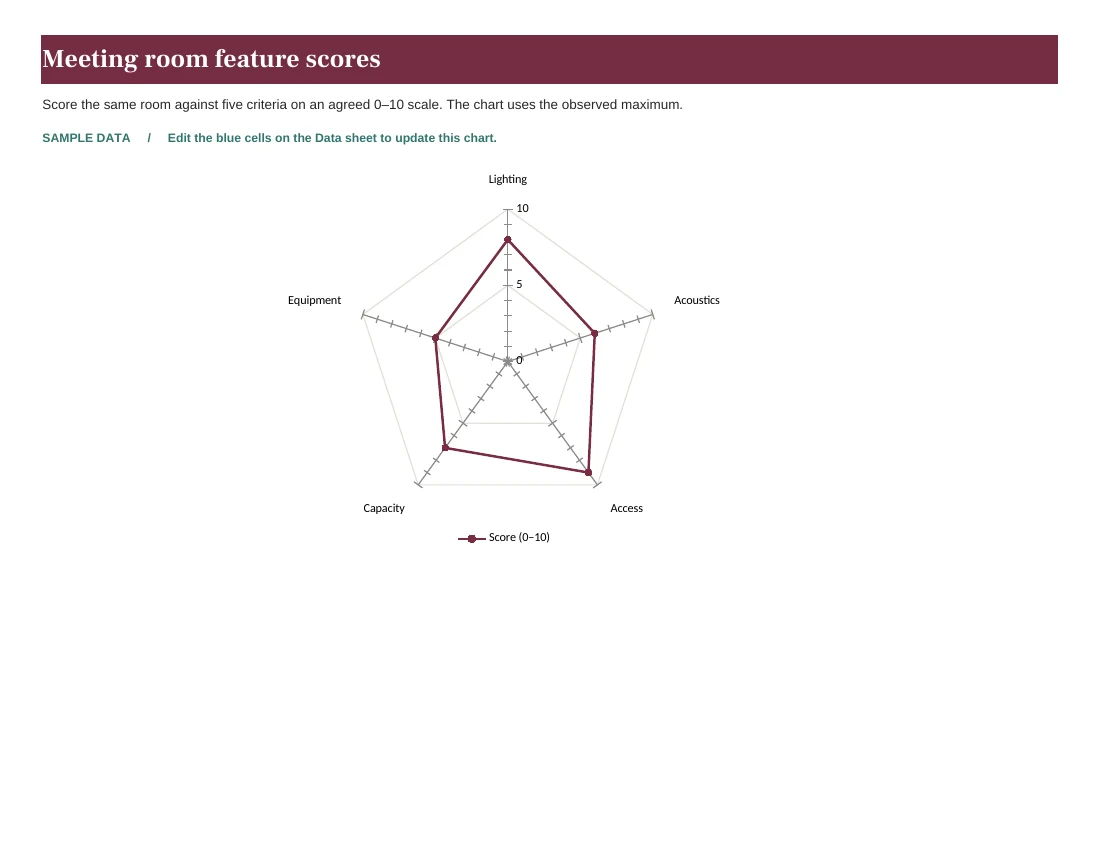
Meeting room feature scores
Score the same room against five criteria on an agreed 0–10 scale. The chart uses the observed maximum.
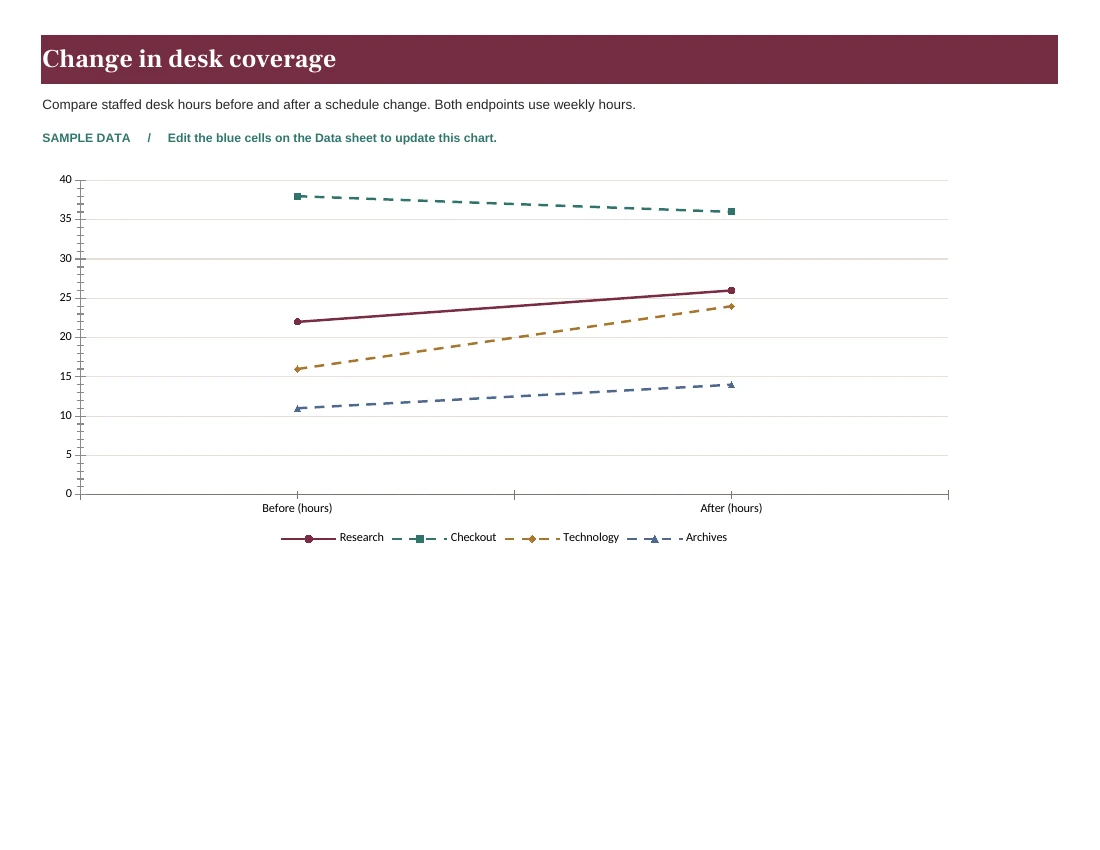
Change in desk coverage
Compare staffed desk hours before and after a schedule change. Both endpoints use weekly hours.
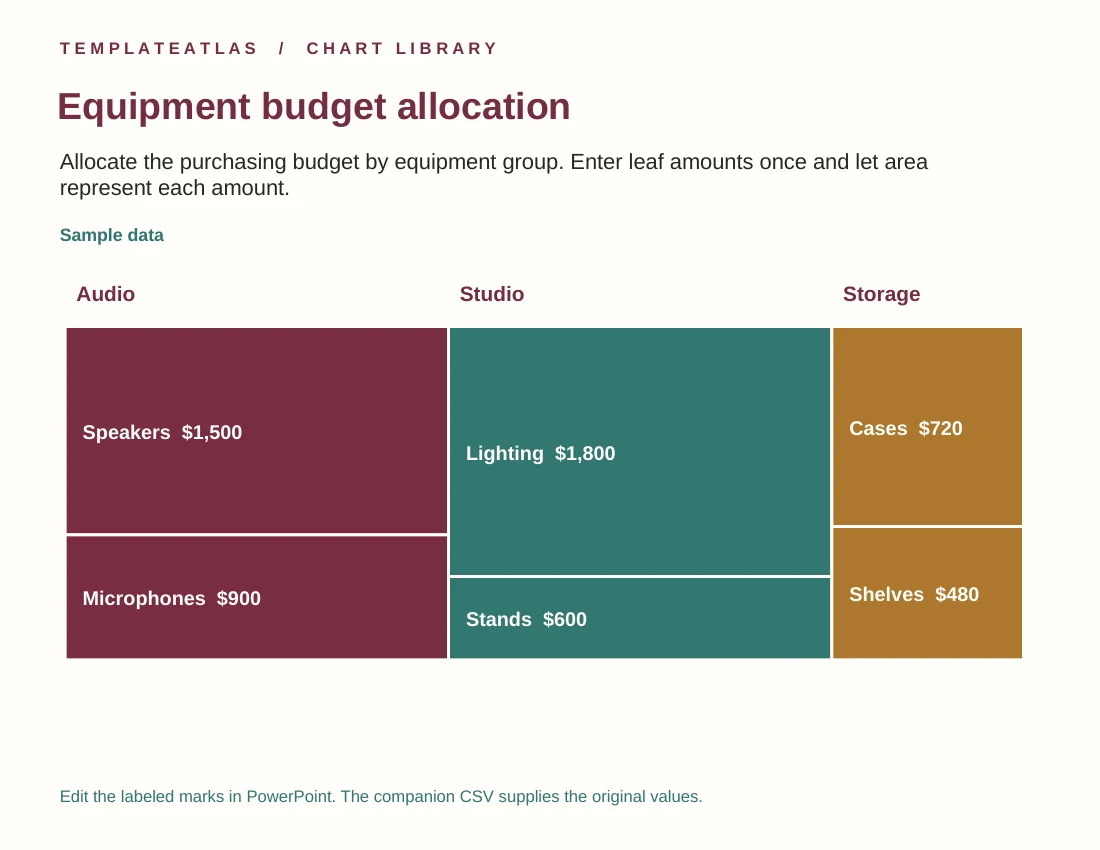
Equipment budget allocation
Allocate the purchasing budget by equipment group. Enter leaf amounts once and let area represent each amount.
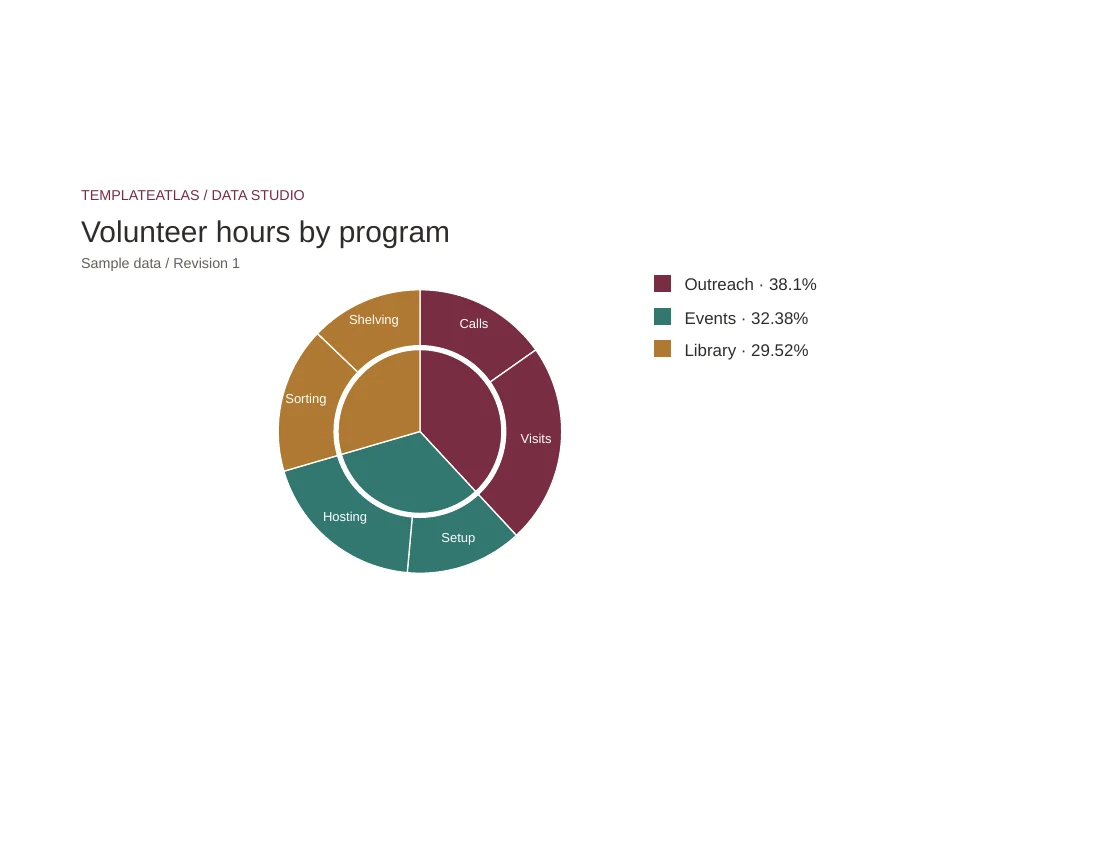
Volunteer hours by program
Compare programs in the inner ring and assignments in the outer ring. Enter hours only at the assignment level.
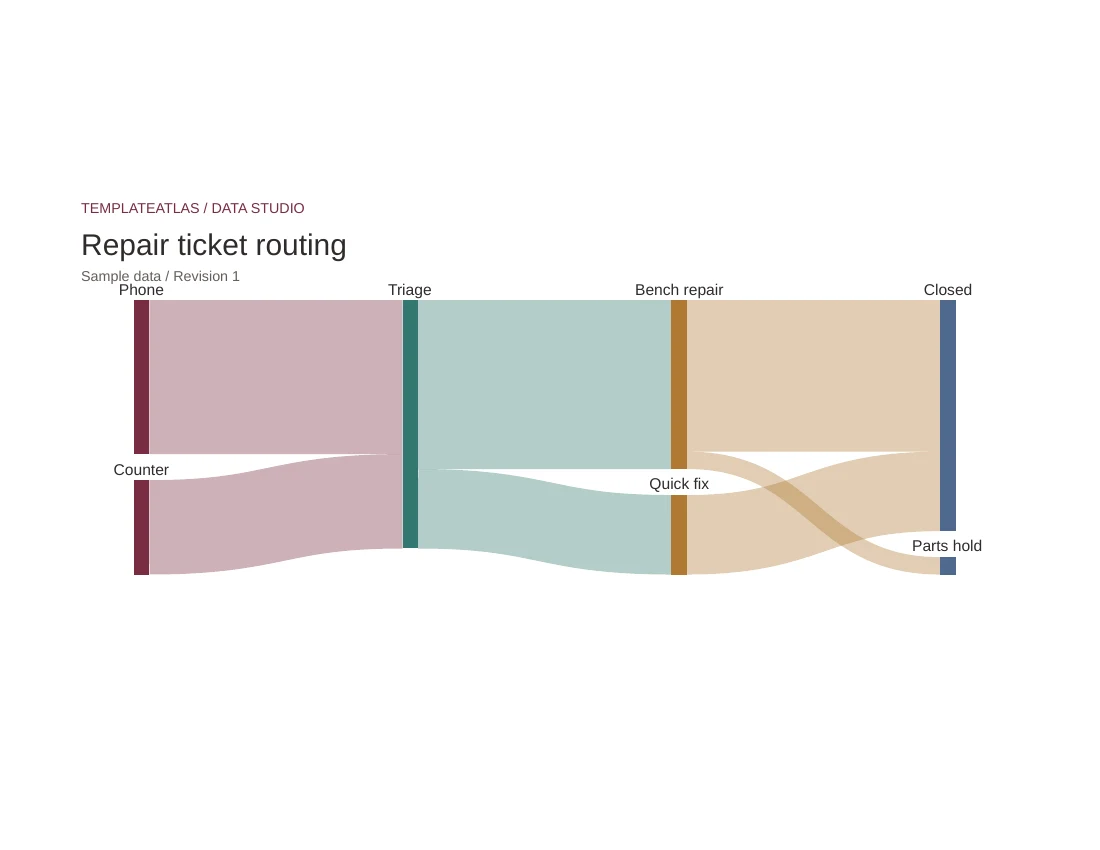
Repair ticket routing
Follow ticket volumes from intake through repair desks and final disposition. Quantities use one shared width scale.
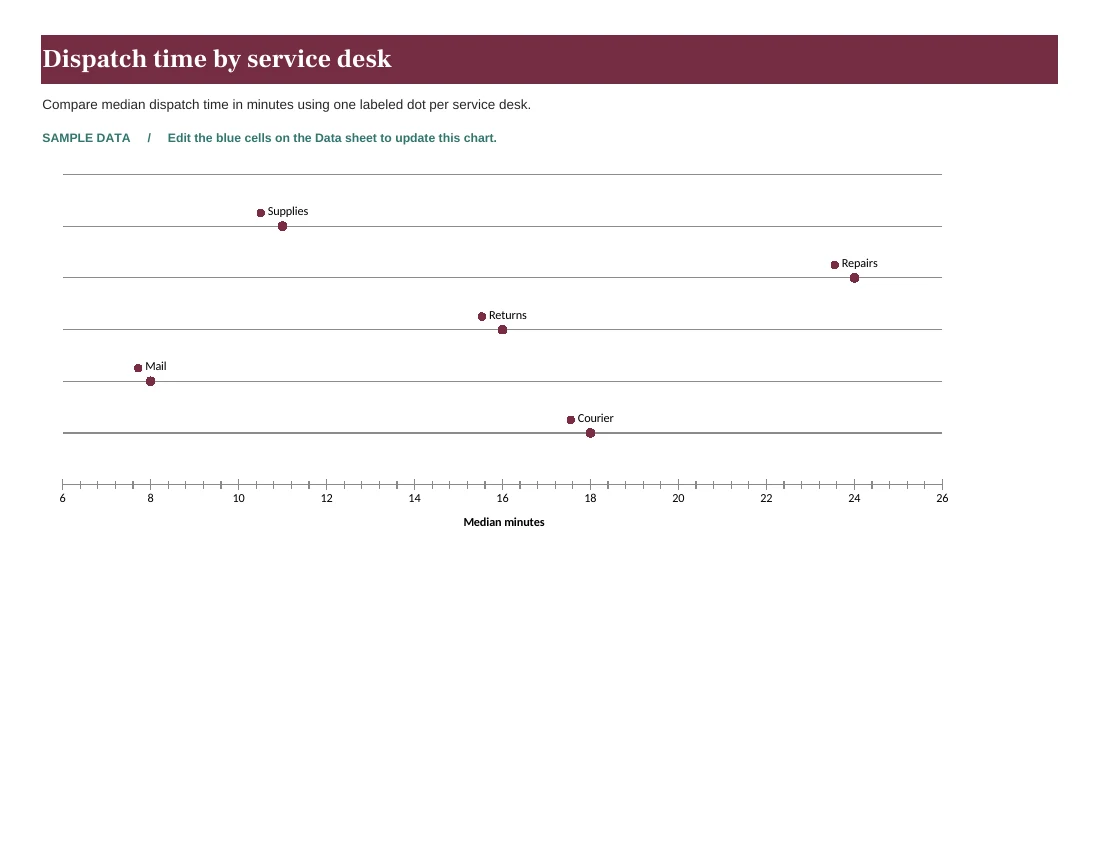
Dispatch time by service desk
Compare median dispatch time in minutes using one labeled dot per service desk.
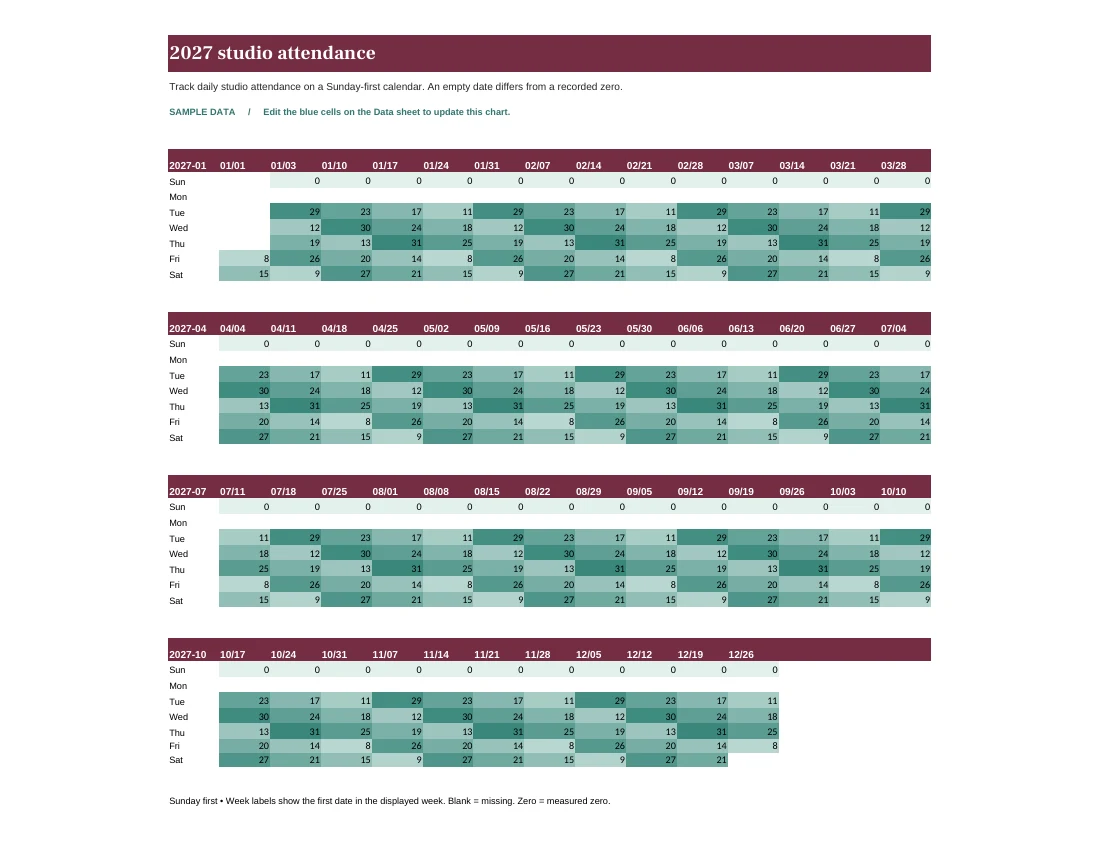
2027 studio attendance
Track daily studio attendance on a Sunday-first calendar. An empty date differs from a recorded zero.