 TemplateAtlas
The TemplateAtlas catalog
Education & STEM Charts
In this collection
16 templates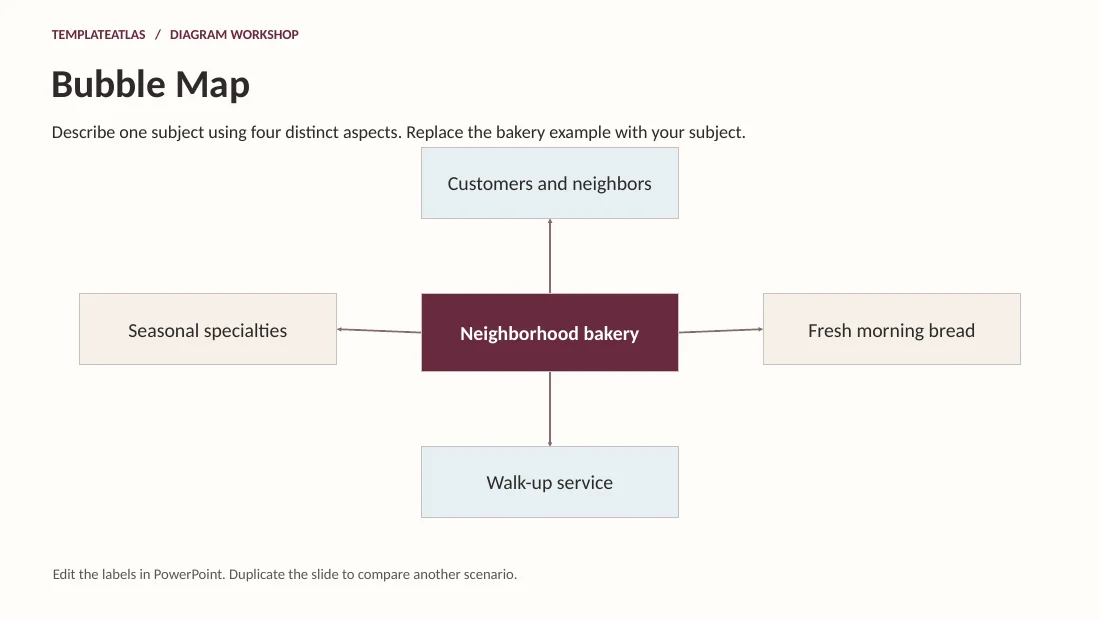
Bubble Map
Describe one subject using four distinct aspects. Replace the bakery example with your subject.
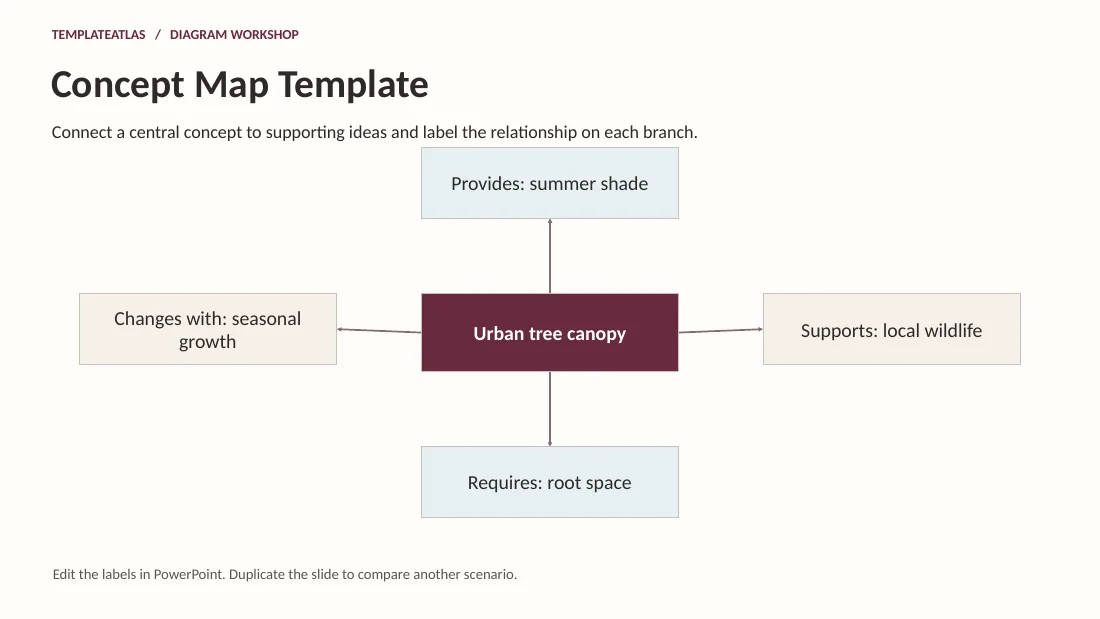
Concept Map Template
Connect a central concept to supporting ideas and label the relationship on each branch.
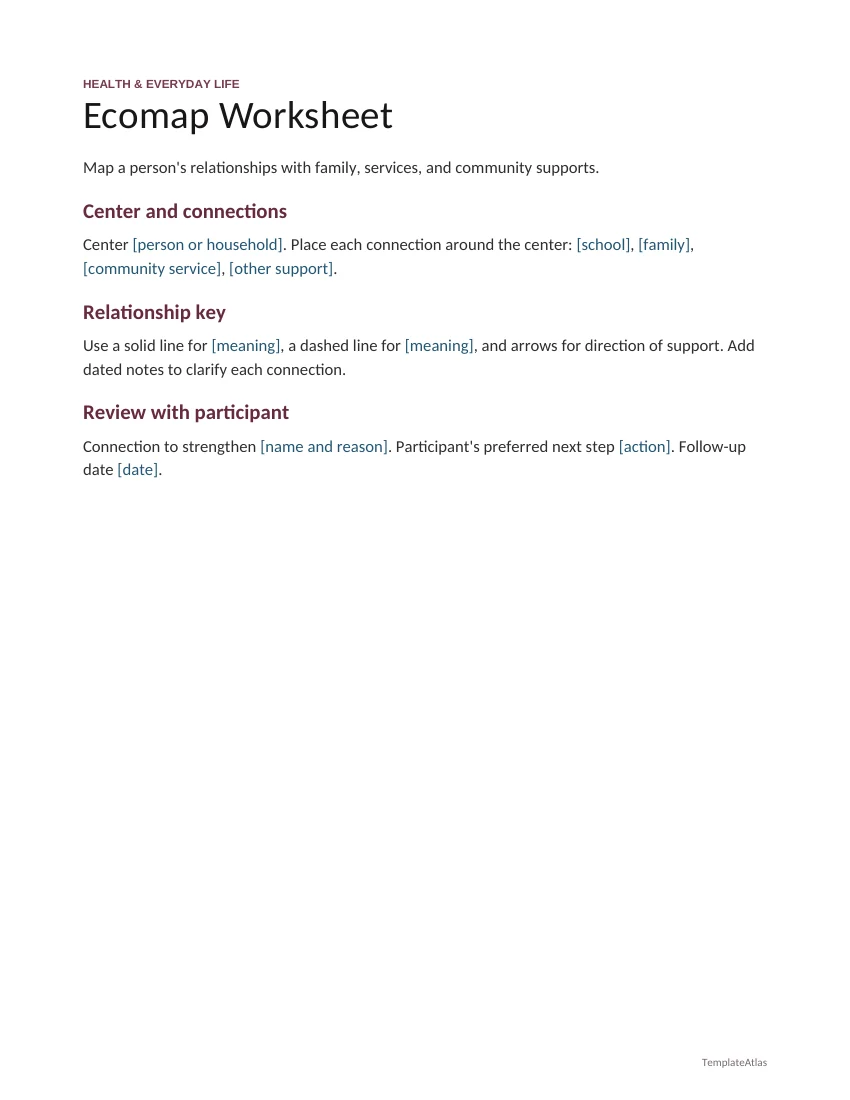
Ecomap Worksheet
Map a person's relationships with family, services, and community supports.
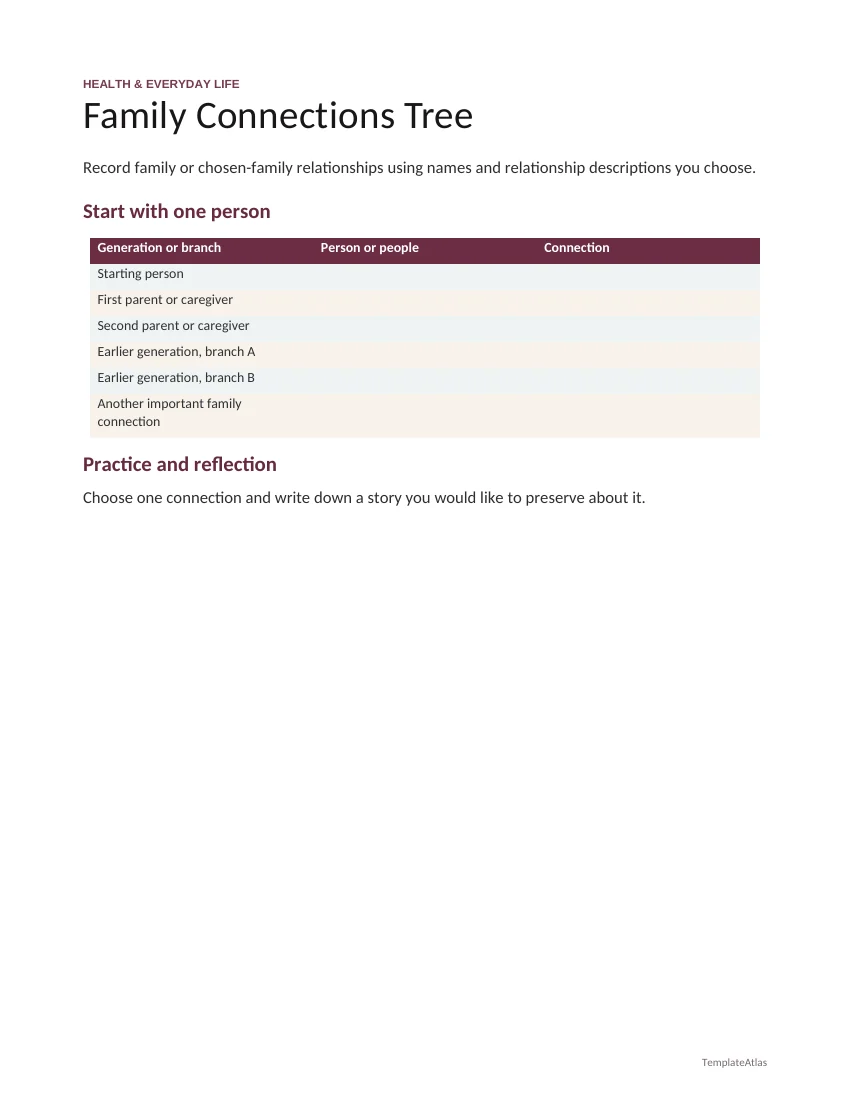
Family Connections Tree
Record family or chosen-family relationships using names and relationship descriptions you choose.
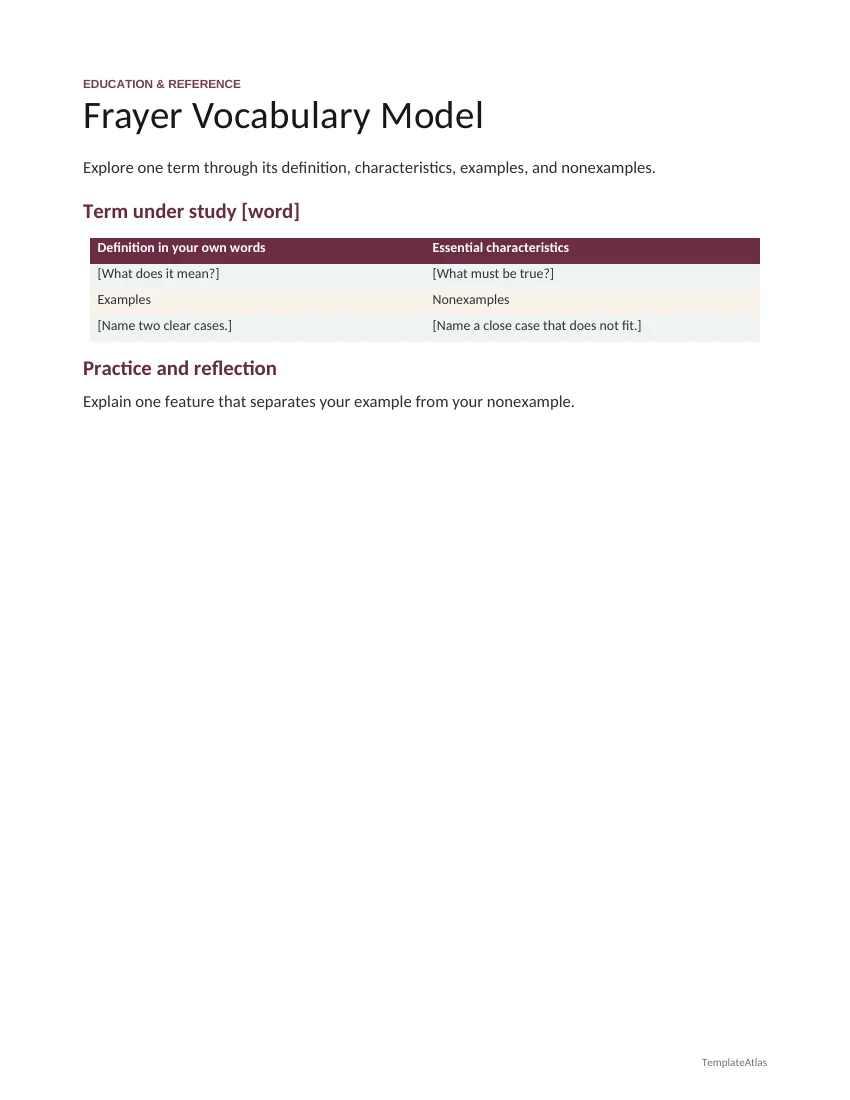
Frayer Vocabulary Model
Explore one term through its definition, characteristics, examples, and nonexamples.
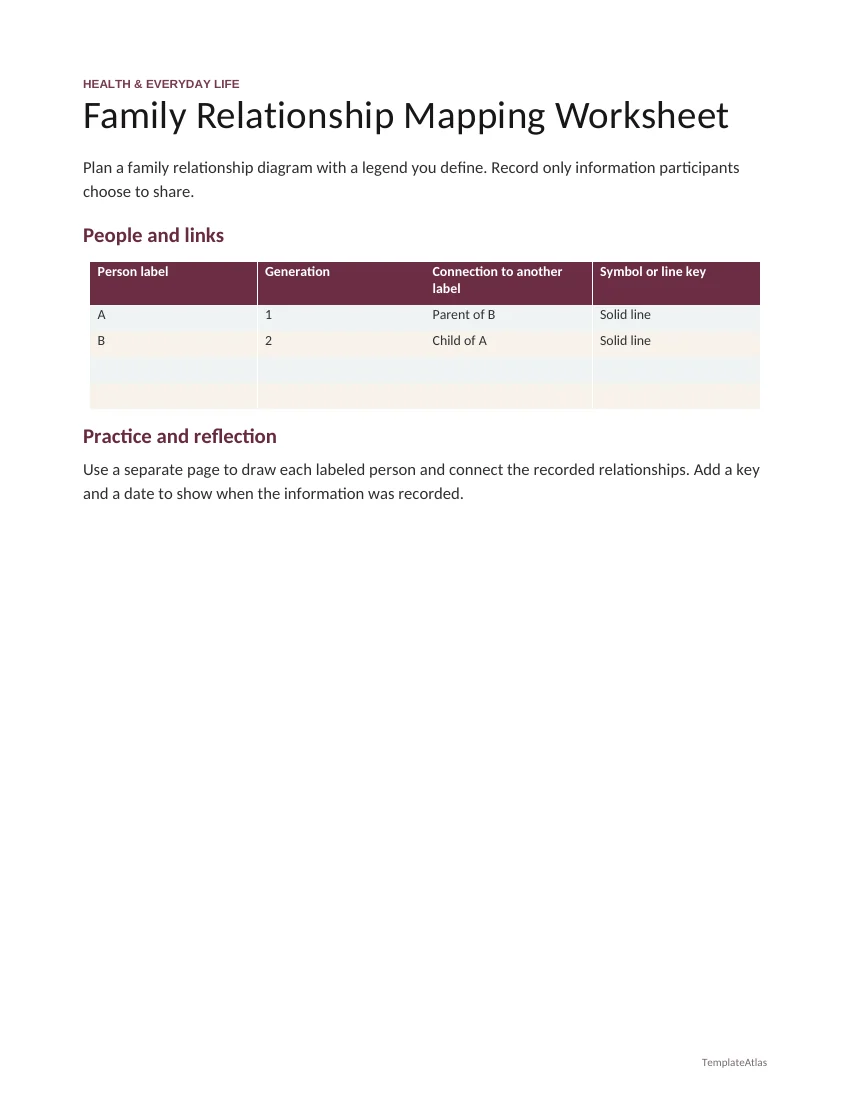
Family Relationship Mapping Worksheet
Plan a family relationship diagram with a legend you define. Record only information participants choose to share.
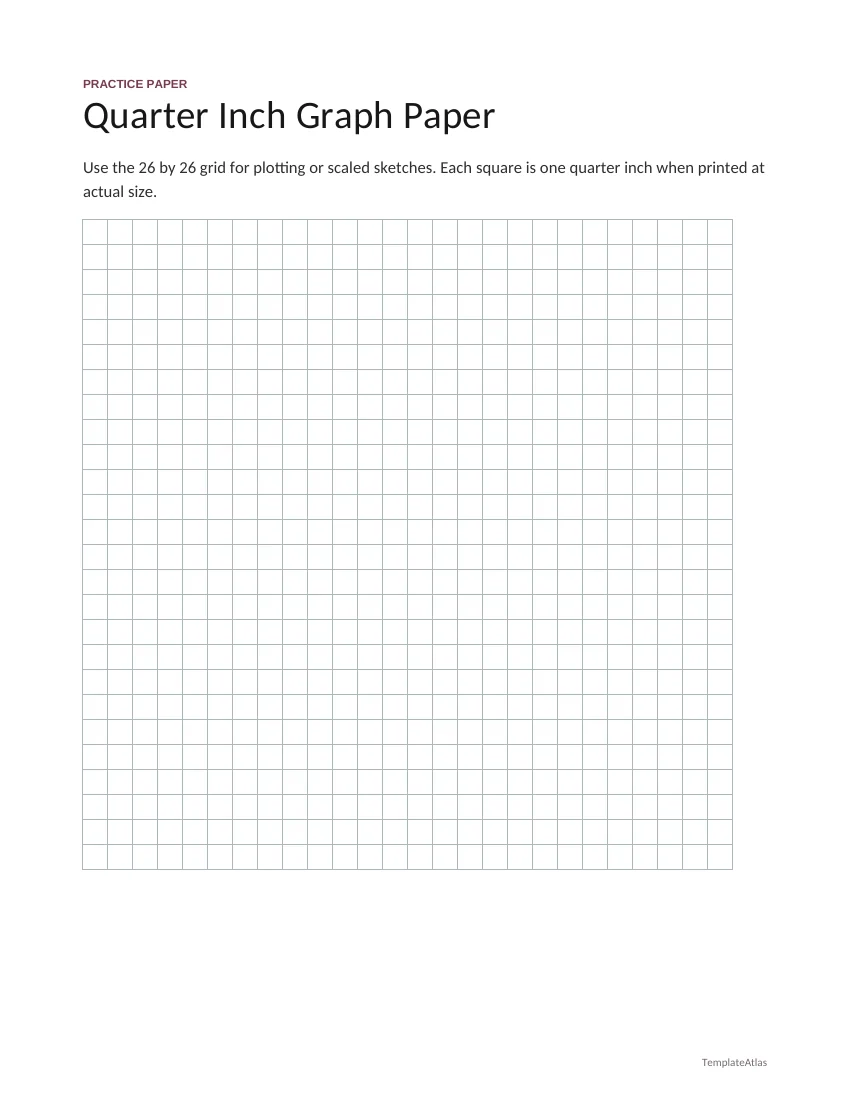
Quarter Inch Graph Paper
Use the 26 by 26 grid for plotting or scaled sketches. Each square is one quarter inch when printed at actual size.
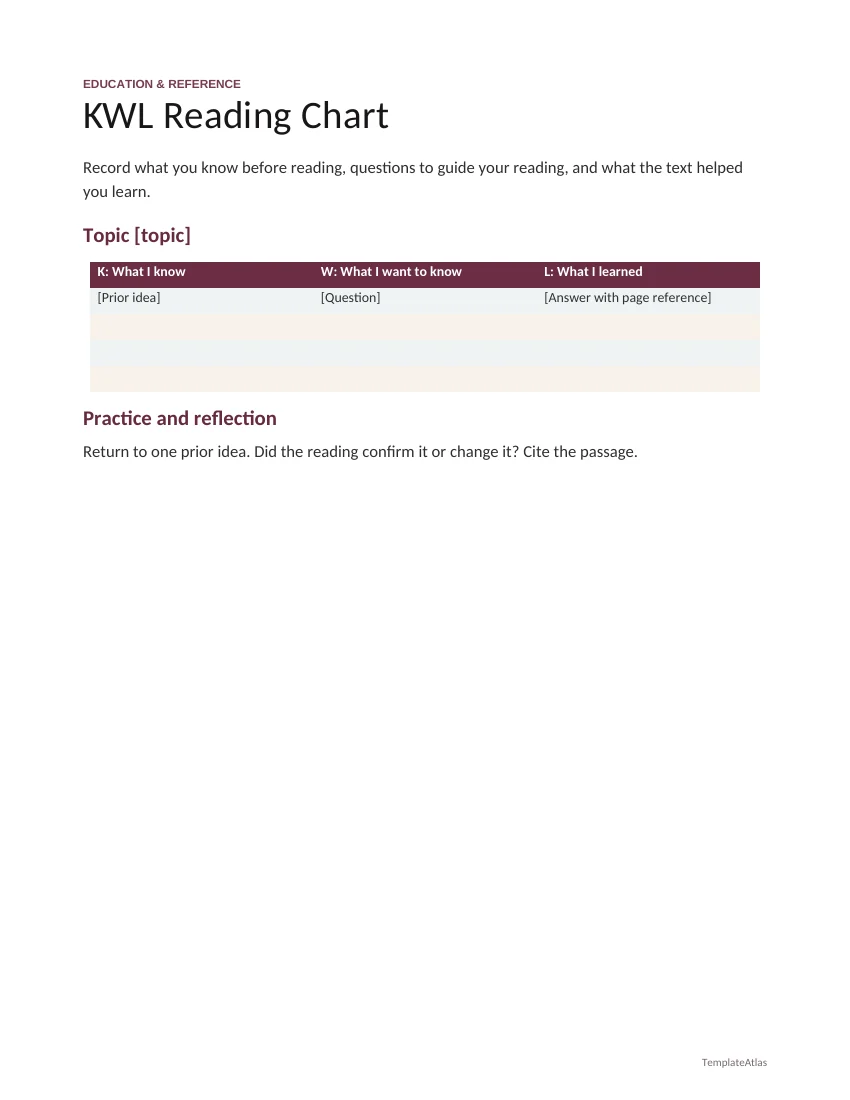
KWL Reading Chart
Record what you know before reading, questions to guide your reading, and what the text helped you learn.
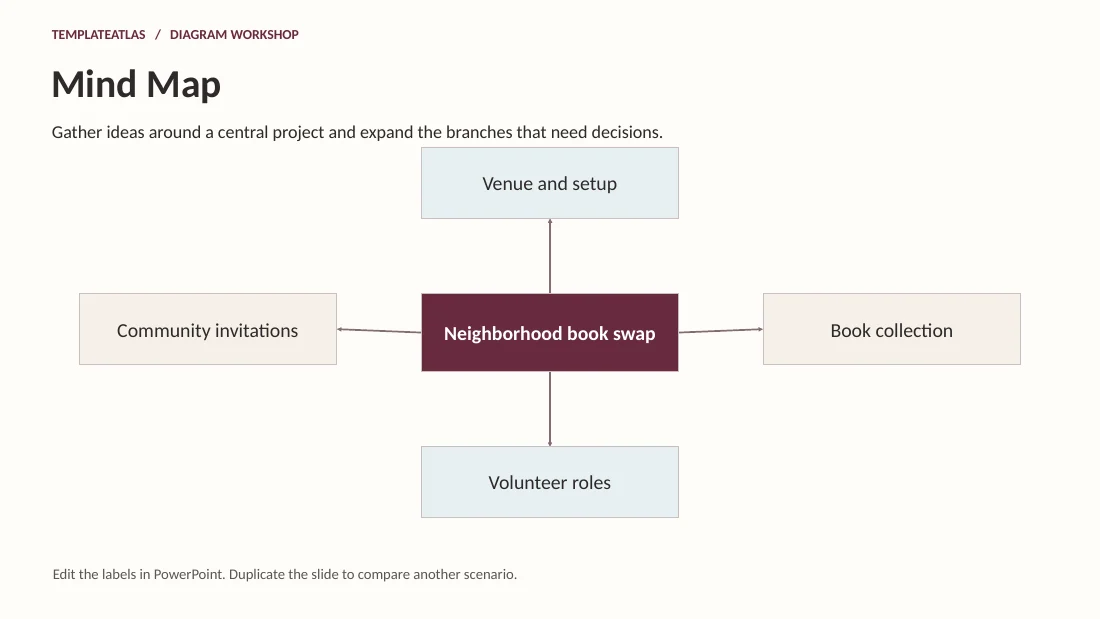
Mind Map
Gather ideas around a central project and expand the branches that need decisions.
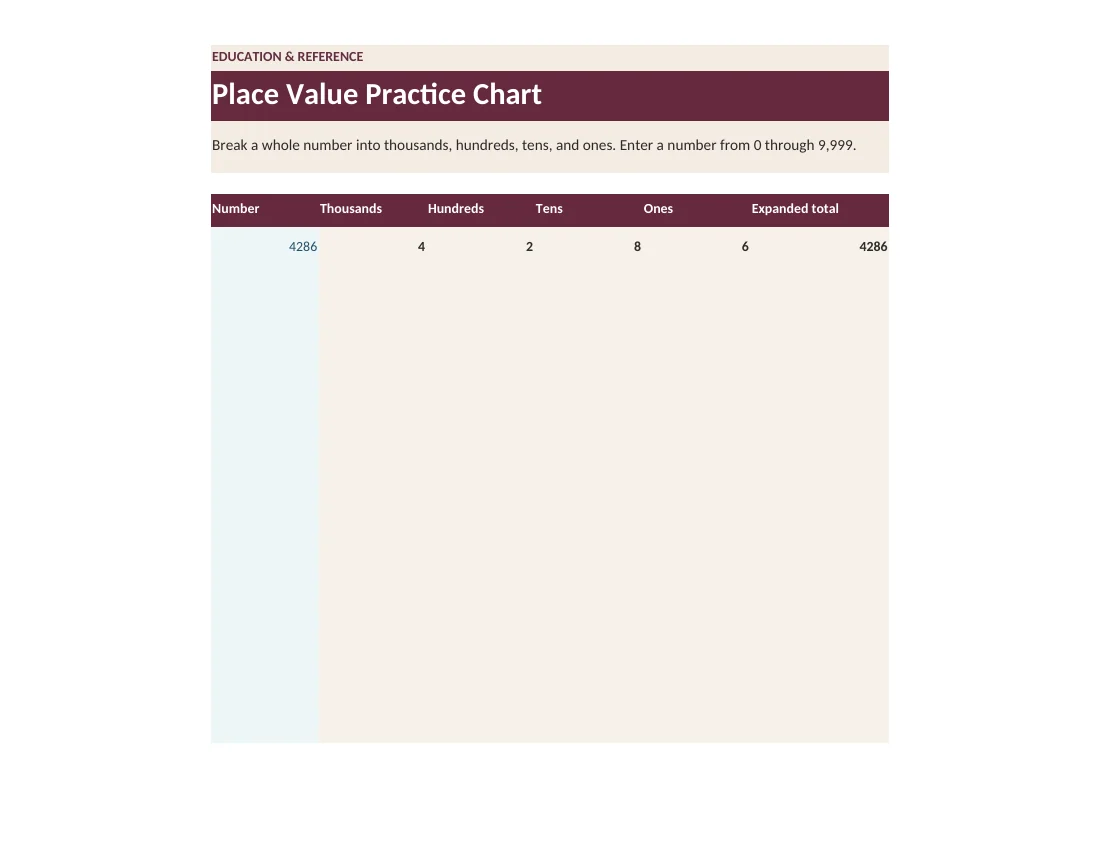
Place Value Practice Chart
Break a whole number into thousands, hundreds, tens, and ones. Enter a number from 0 through 9,999.
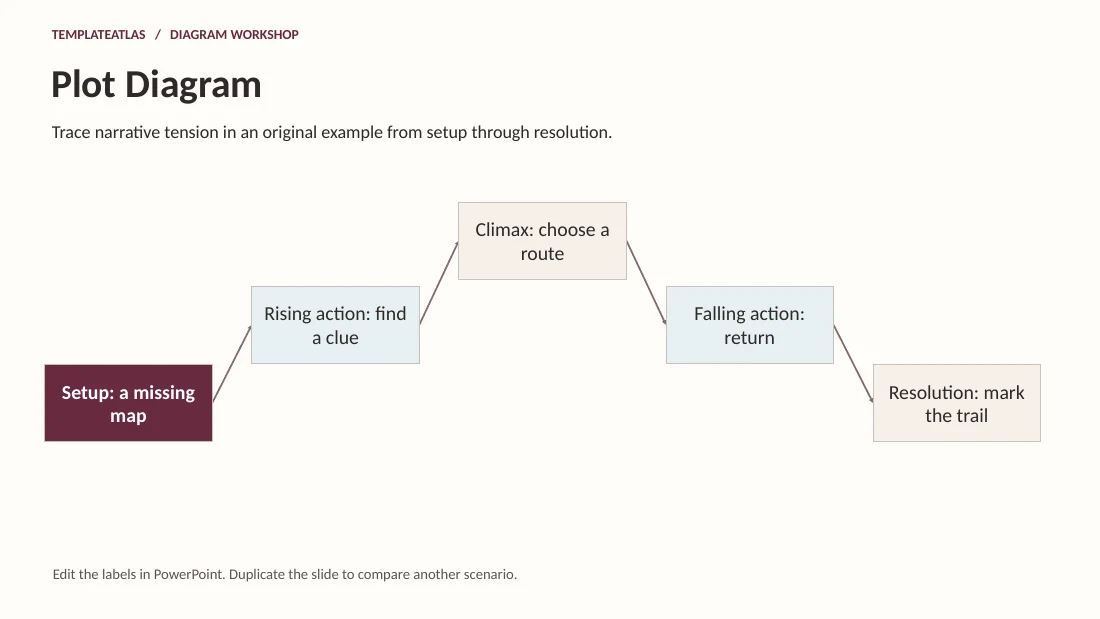
Plot Diagram
Trace narrative tension in an original example from setup through resolution.
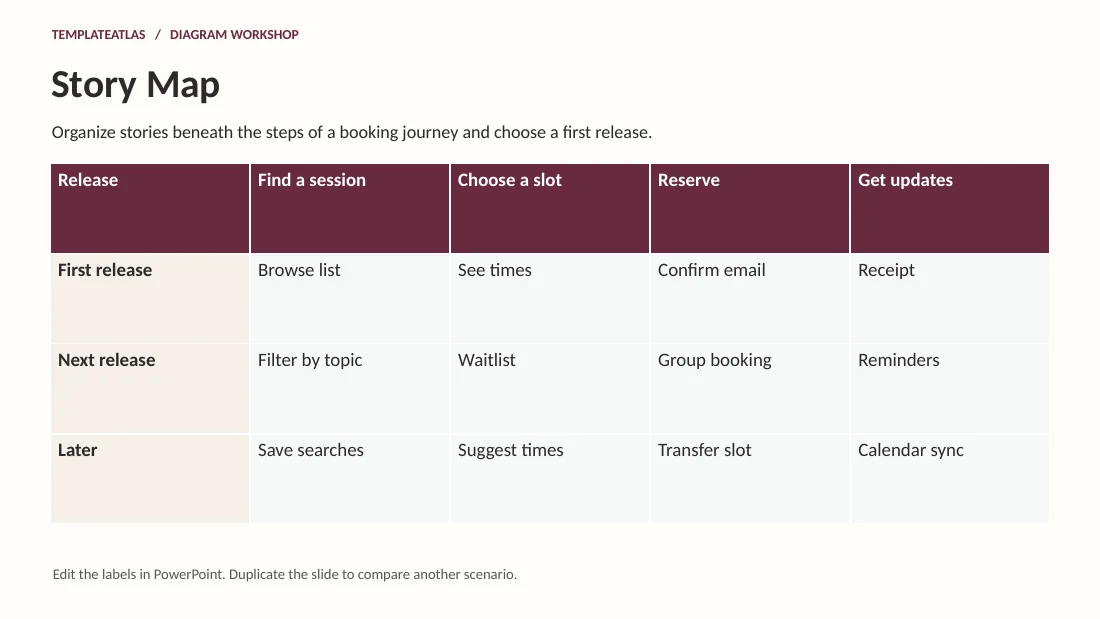
Story Map
Organize stories beneath the steps of a booking journey and choose a first release.
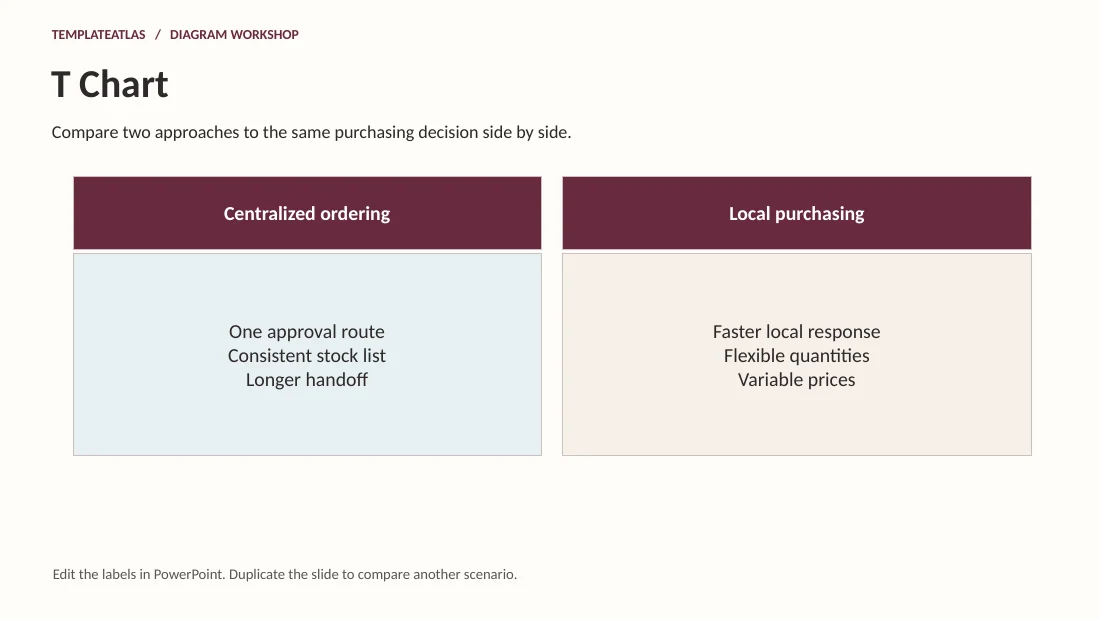
T Chart
Compare two approaches to the same purchasing decision side by side.
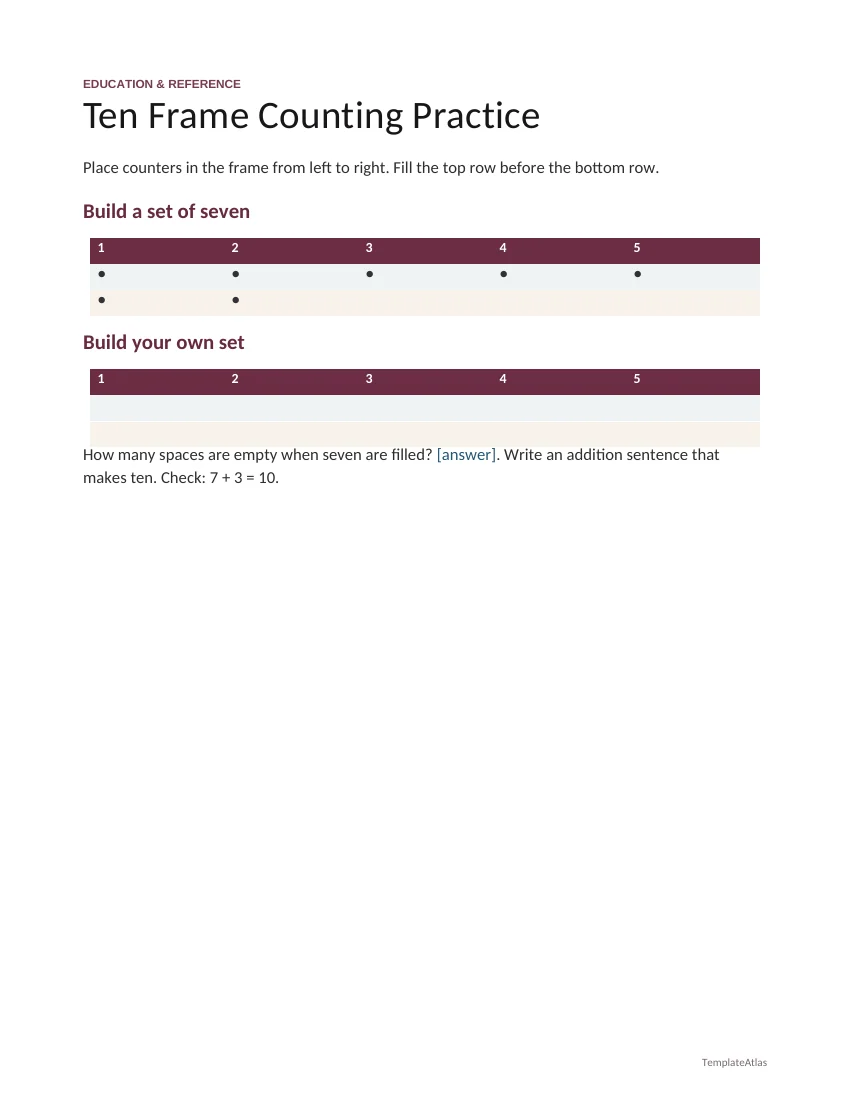
Ten Frame Counting Practice
Place counters in the frame from left to right. Fill the top row before the bottom row.
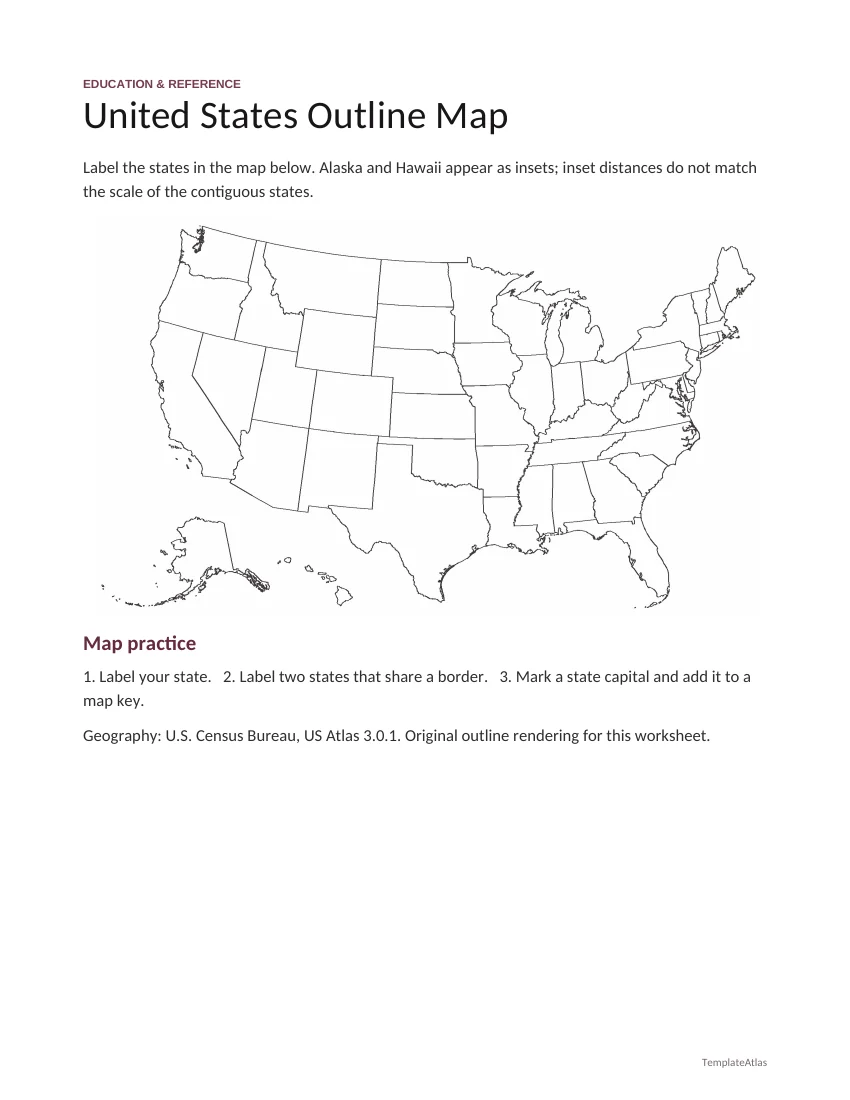
United States Outline Map
Label the states in the map below. Alaska and Hawaii appear as insets; inset distances do not match the scale of the contiguous states.
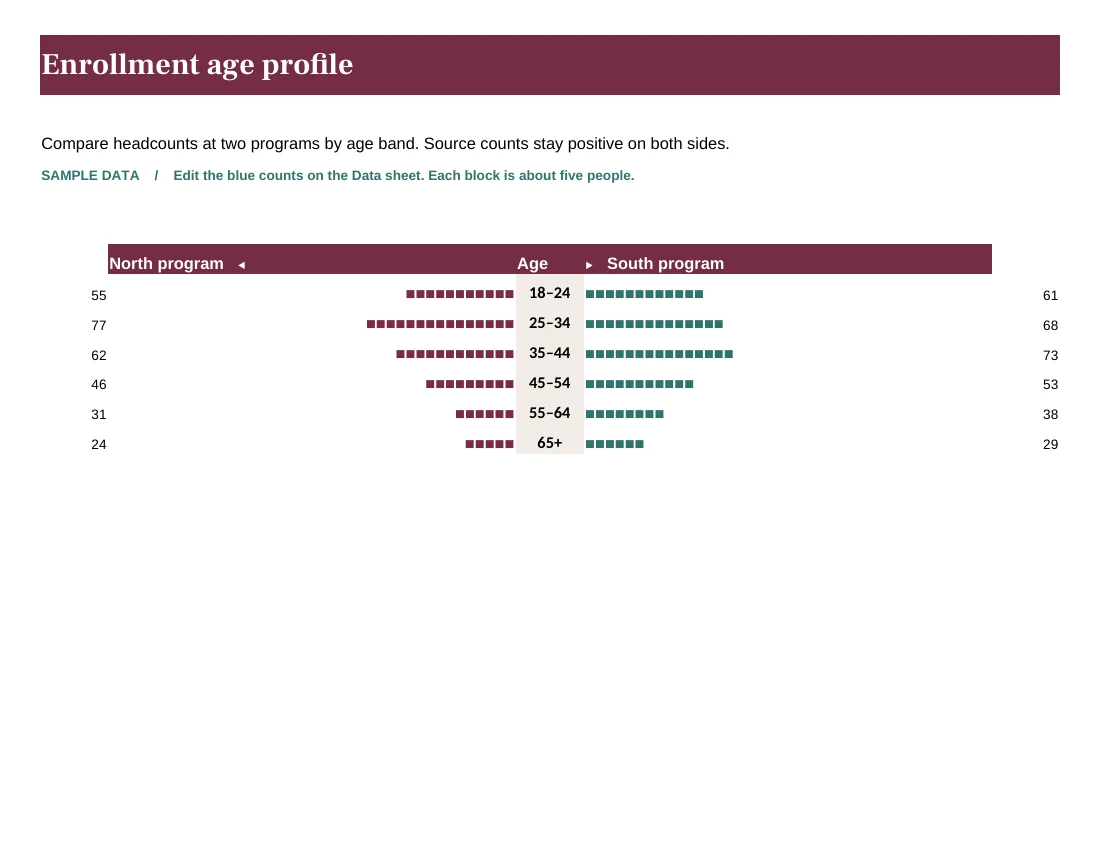
Enrollment age profile
Compare headcounts at two programs by age band. Source counts stay positive on both sides.