
Amber Molecular Detail
R-134a US Detailed Chart — Amber Molecular Detail
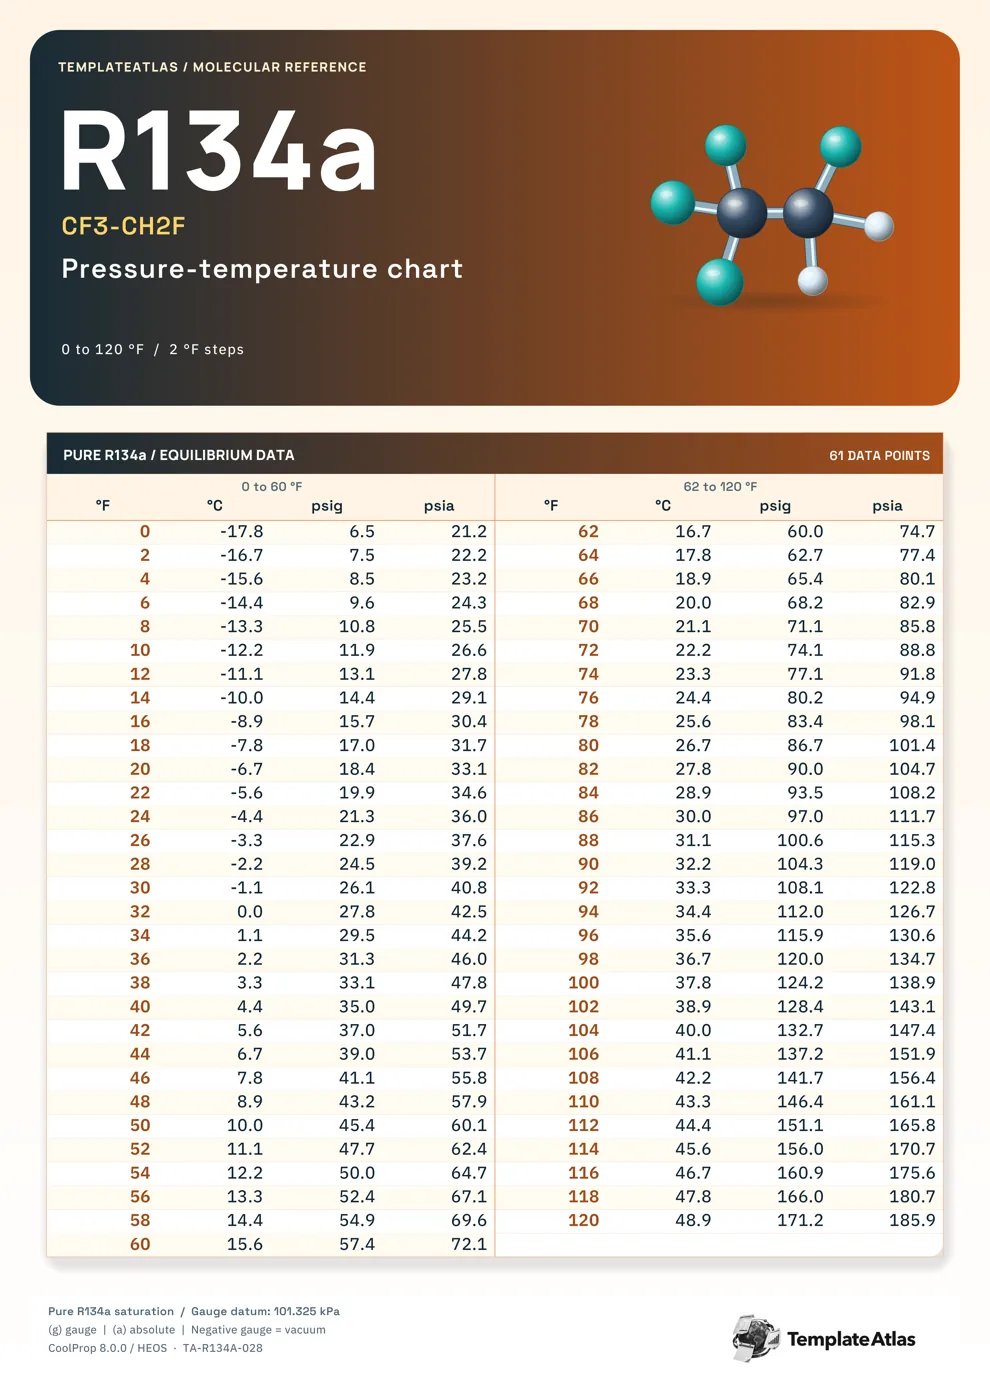
A ball-and-stick model contrasts with the amber heading above a Fahrenheit table that separates gauge and absolute pressure.
This chart gives a closer-spaced view of the R-134a pressure-temperature relationship, using 2°F increments. Follow a Fahrenheit row across to compare its Celsius equivalent with both gauge pressure and absolute pressure in psi. This amber molecular detail version covers 0 to 120°F in 2°F steps.
The molecular illustration identifies the refrigerant visually, while the numerical saturation values remain in a separate table underneath. The 61 listed reference points use Fahrenheit, Celsius, psi gauge, psi absolute.
Using this reference
The PDF preserves the one-page print layout. The matching Image is a full-resolution WebP rendering. These are finished reference sheets with fixed data and illustrations.
Gauge pressure uses a 101.325 kPa atmospheric reference. Saturation values describe the refrigerant relationship; equipment instructions determine operating and charging targets.
File checksums
PDF SHA-256d9689dbd9a3829556c75ff67f9aa4c48125f35af34d27918ea4e9037c7d1fbdc
WEBP SHA-256c533ffd9a17eef6054c6858cfd8f1441b75105c59d7396bf4d129d960bd4c145
Data, sources, and credits
This collection uses CoolProp 8.0.0 / HEOS R-134a saturation data. The supplied method records comparisons with Arkema and Chemours reference tables.