 TemplateAtlas
The TemplateAtlas catalog
Charts & Graphs
Explore data visualizations, process diagrams, and reference charts. Build a chart from your own numbers in Chart Studio.
Open Chart Studio →Choose a chart to build
In this collection
131 templates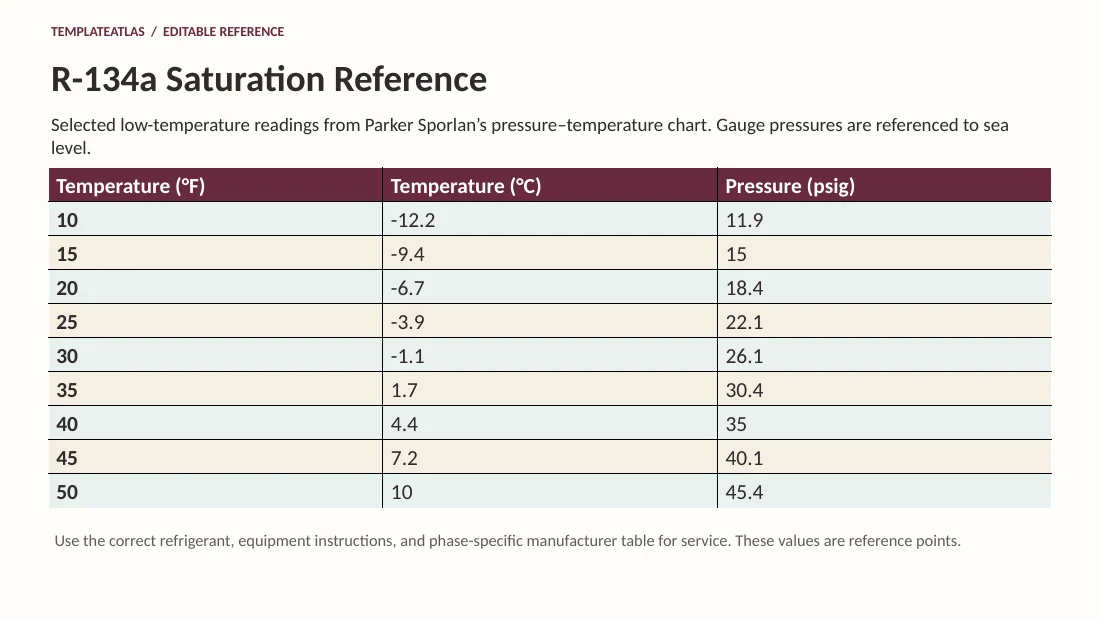
R-134a Saturation Reference
Selected low-temperature readings from Parker Sporlan’s pressure–temperature chart. Gauge pressures are referenced to sea level.
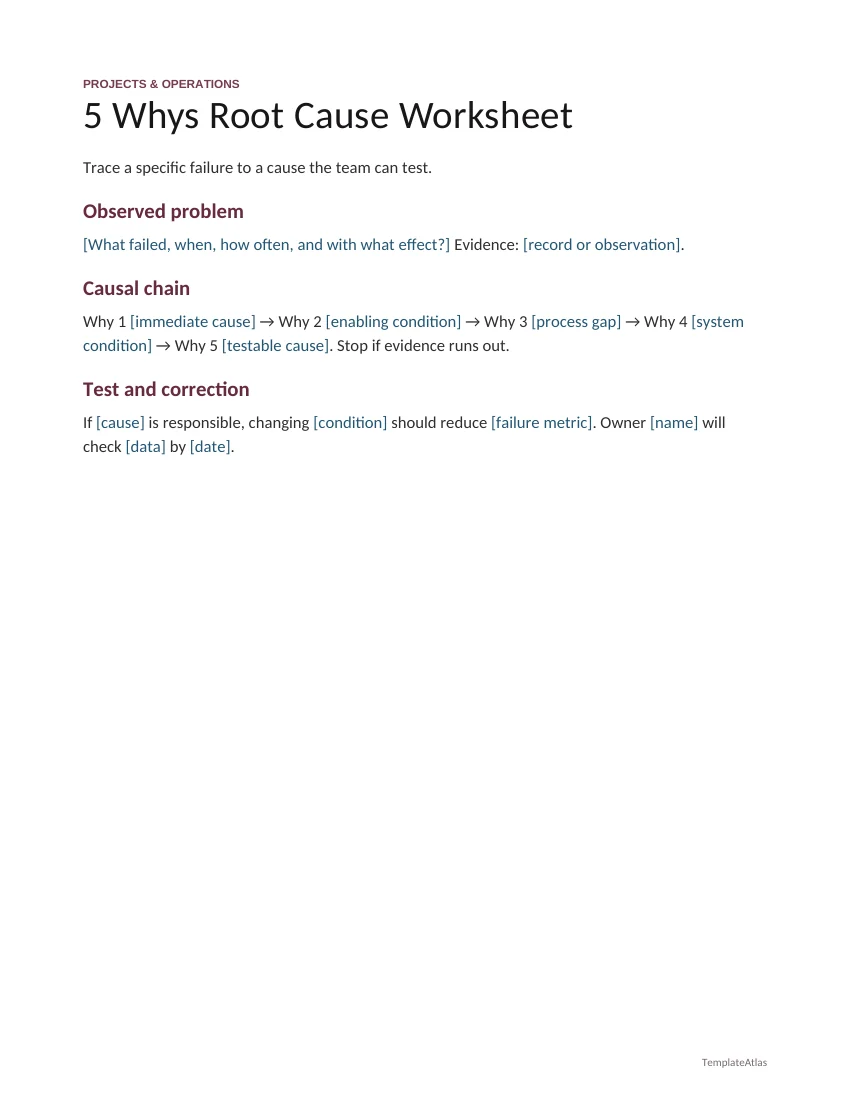
5 Whys Root Cause Worksheet
Trace a specific failure to a cause the team can test.
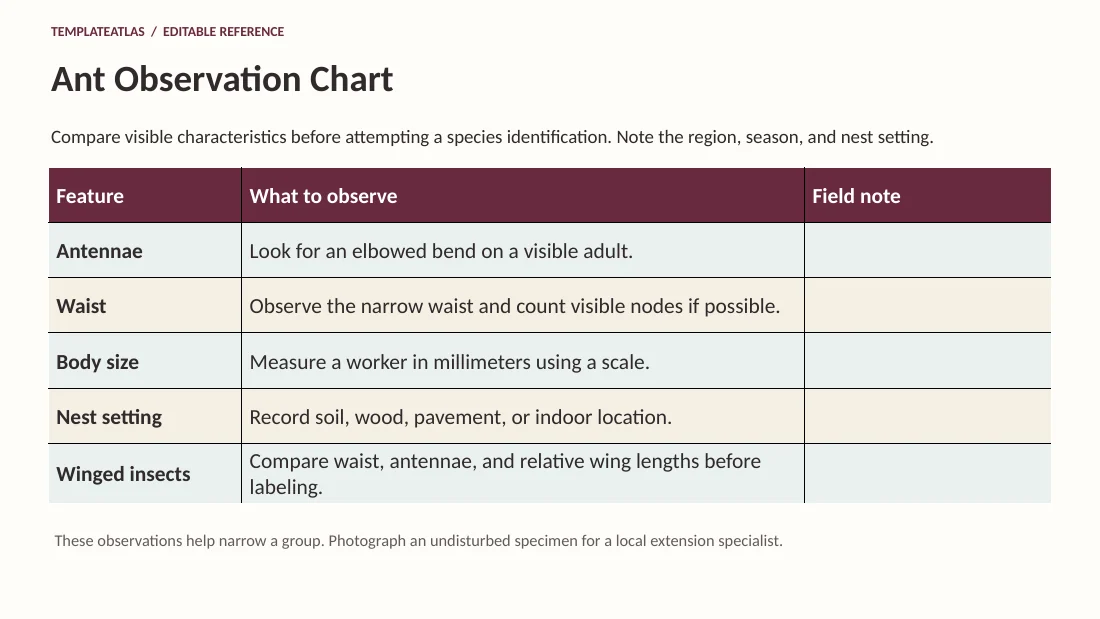
Ant Observation Chart
Compare visible characteristics before attempting a species identification. Note the region, season, and nest setting.
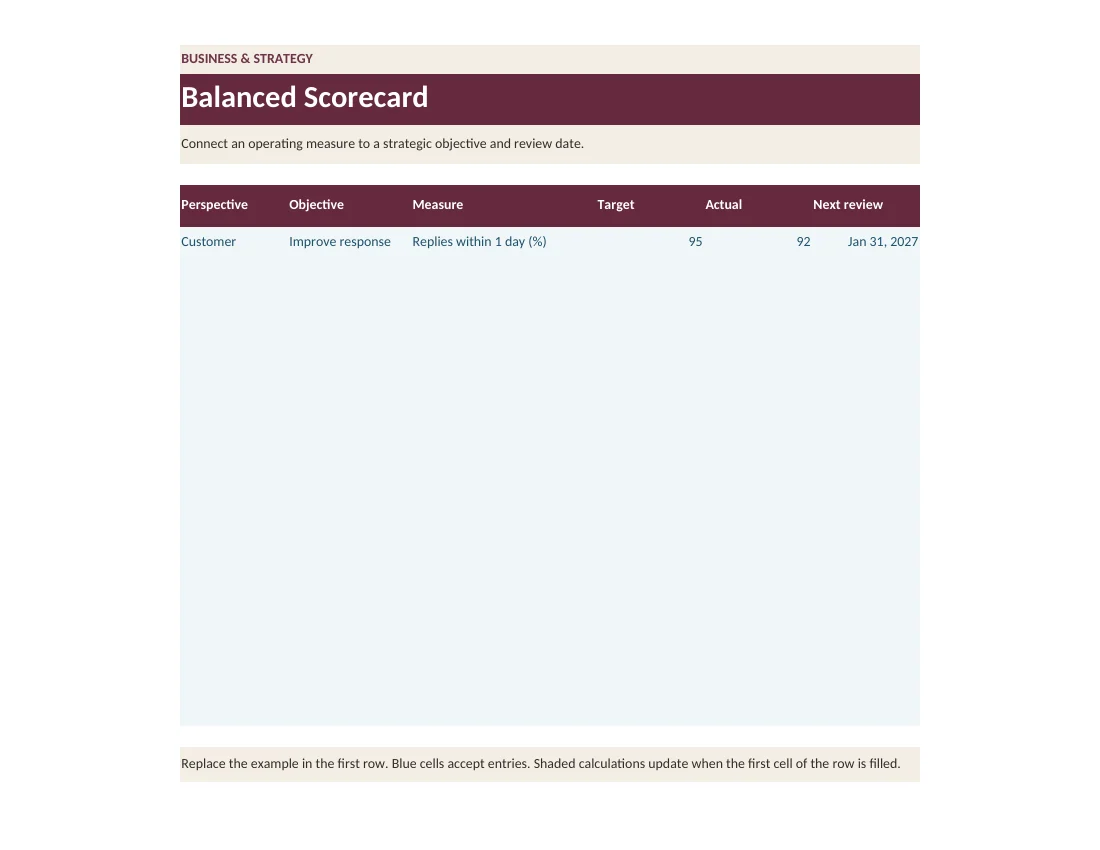
Balanced Scorecard
Connect an operating measure to a strategic objective and review date.
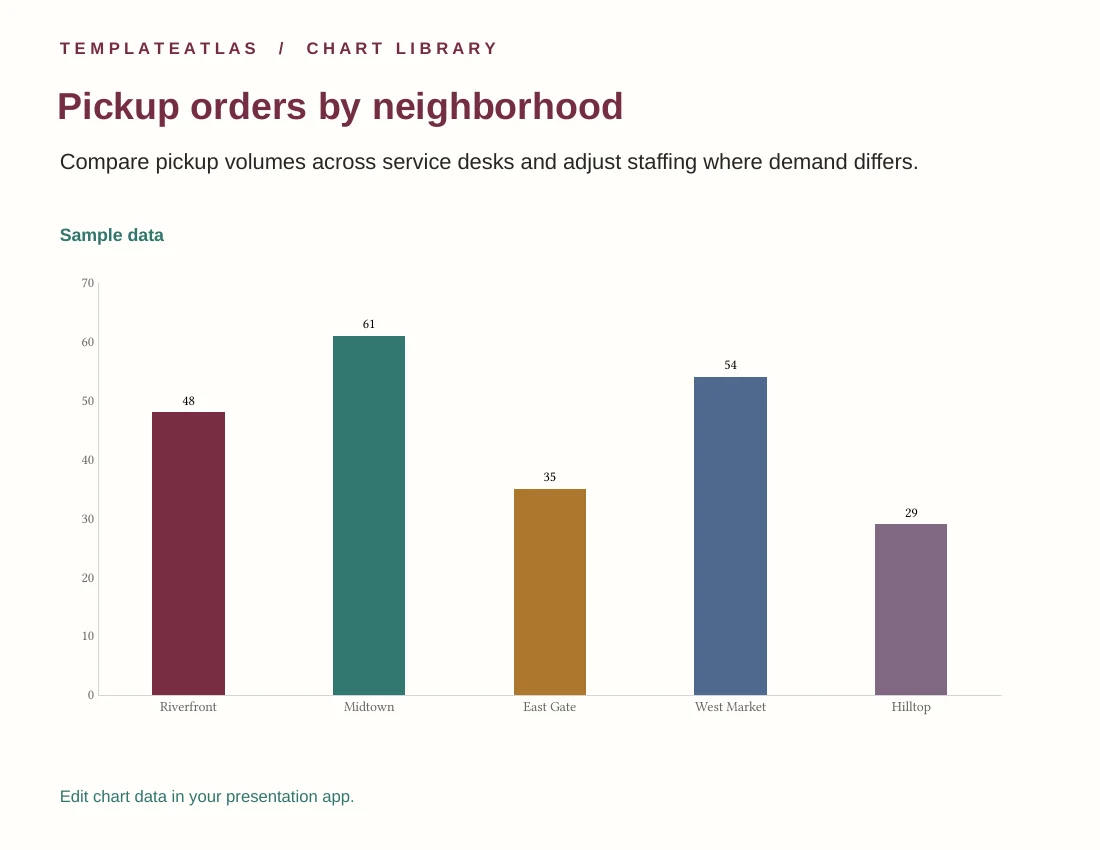
Pickup orders by neighborhood
Compare pickup volumes across service desks and adjust staffing where demand differs.
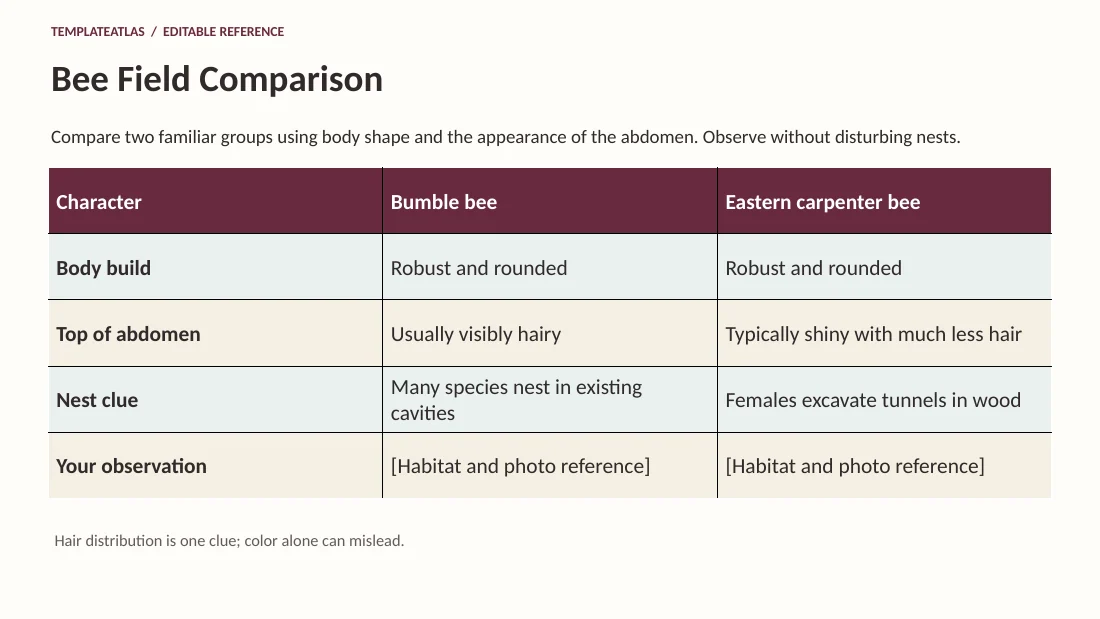
Bee Field Comparison
Compare two familiar groups using body shape and the appearance of the abdomen. Observe without disturbing nests.
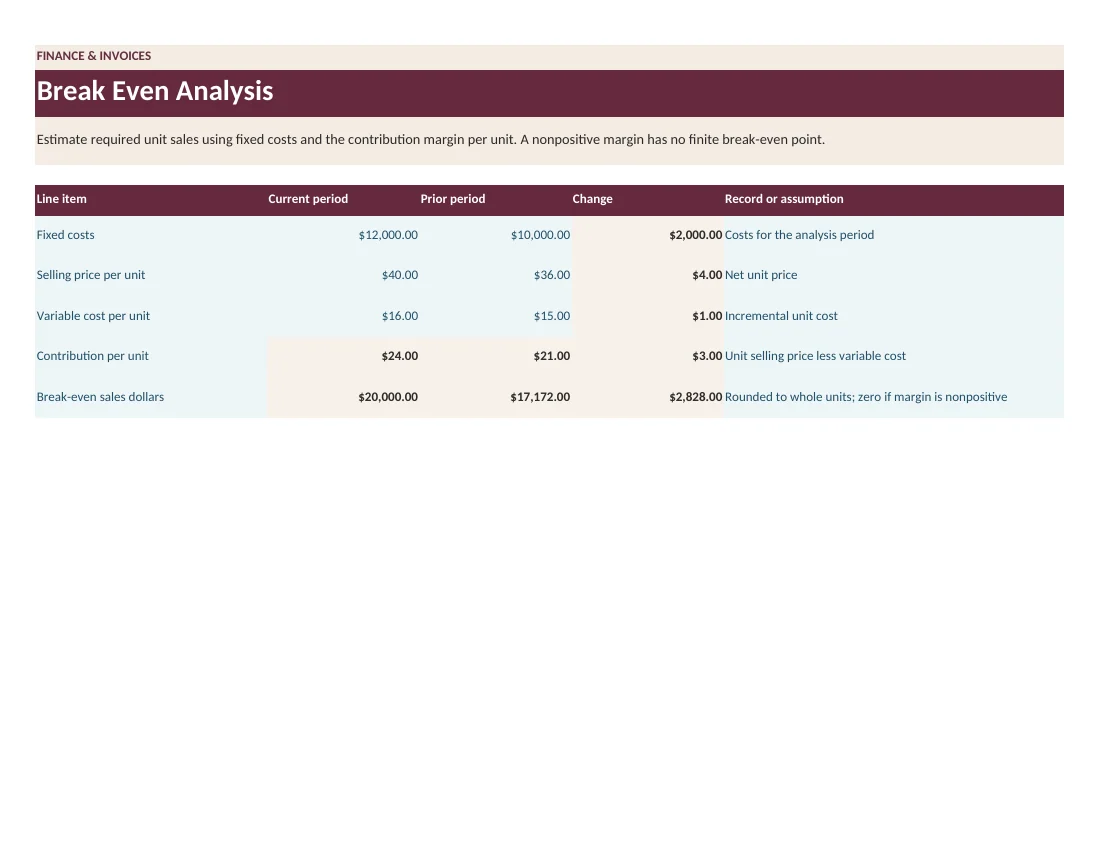
Break Even Analysis
Estimate required unit sales using fixed costs and the contribution margin per unit. A nonpositive margin has no finite break-even point.
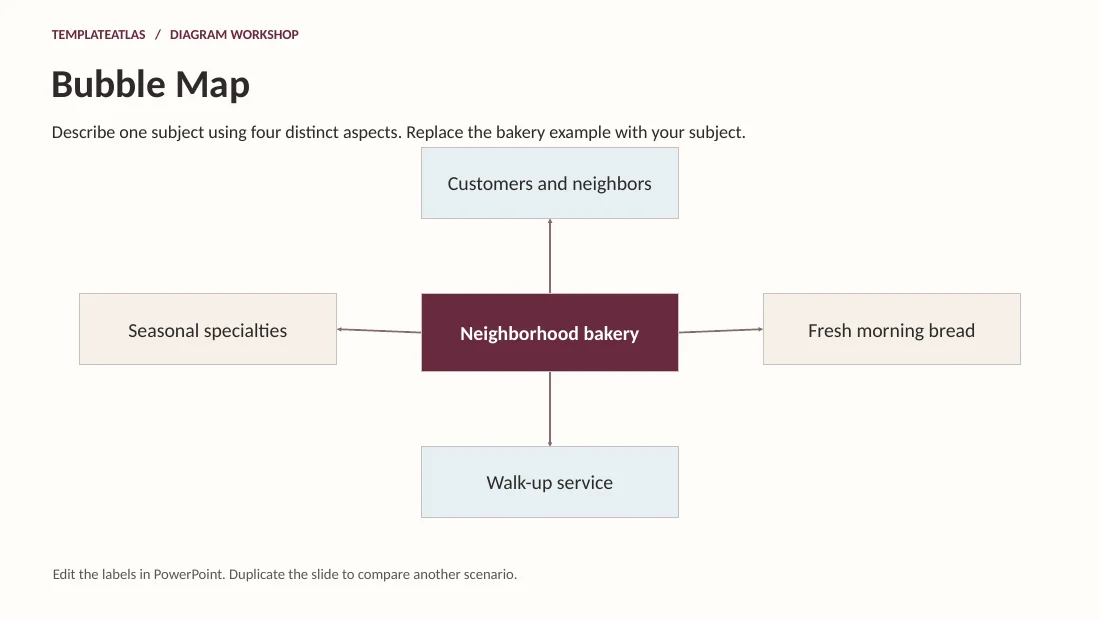
Bubble Map
Describe one subject using four distinct aspects. Replace the bakery example with your subject.
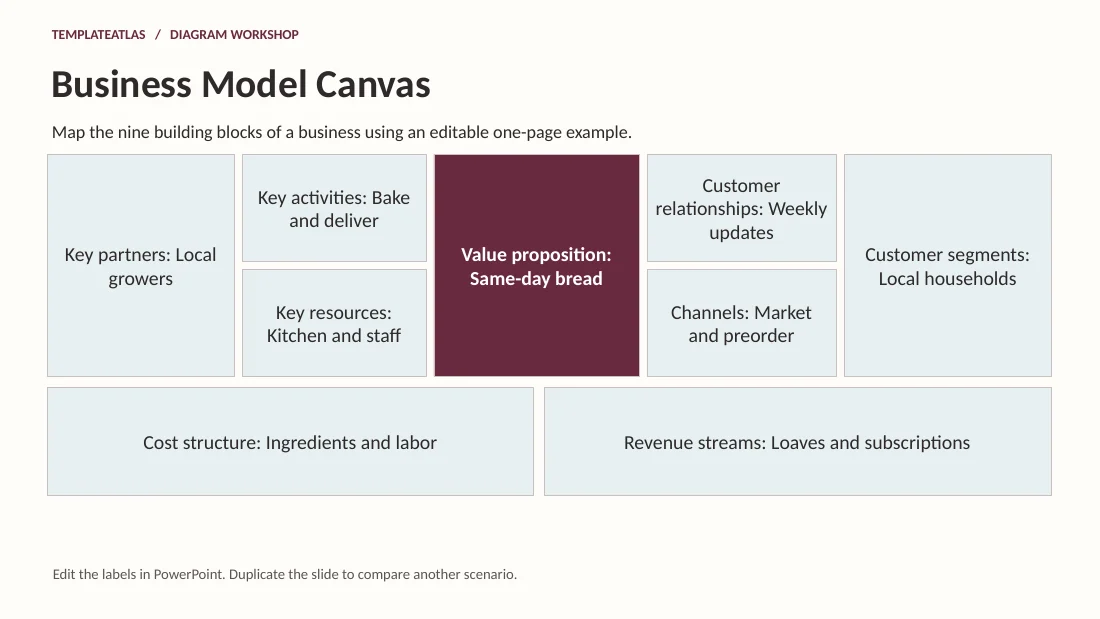
Business Model Canvas
Map the nine building blocks of a business using an editable one-page example.
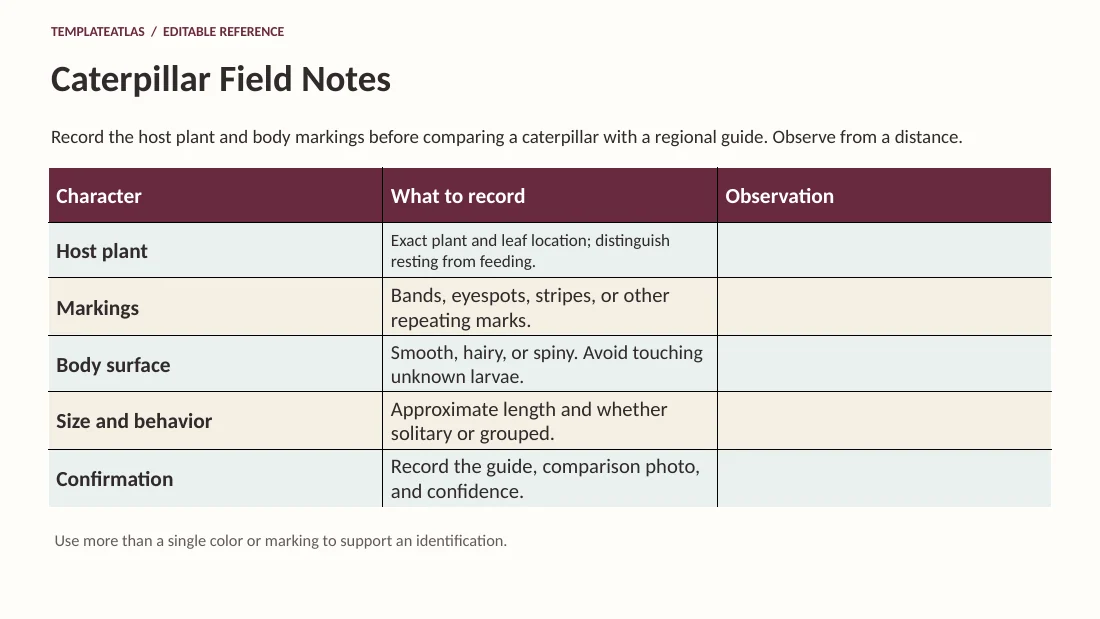
Caterpillar Field Notes
Record the host plant and body markings before comparing a caterpillar with a regional guide. Observe from a distance.
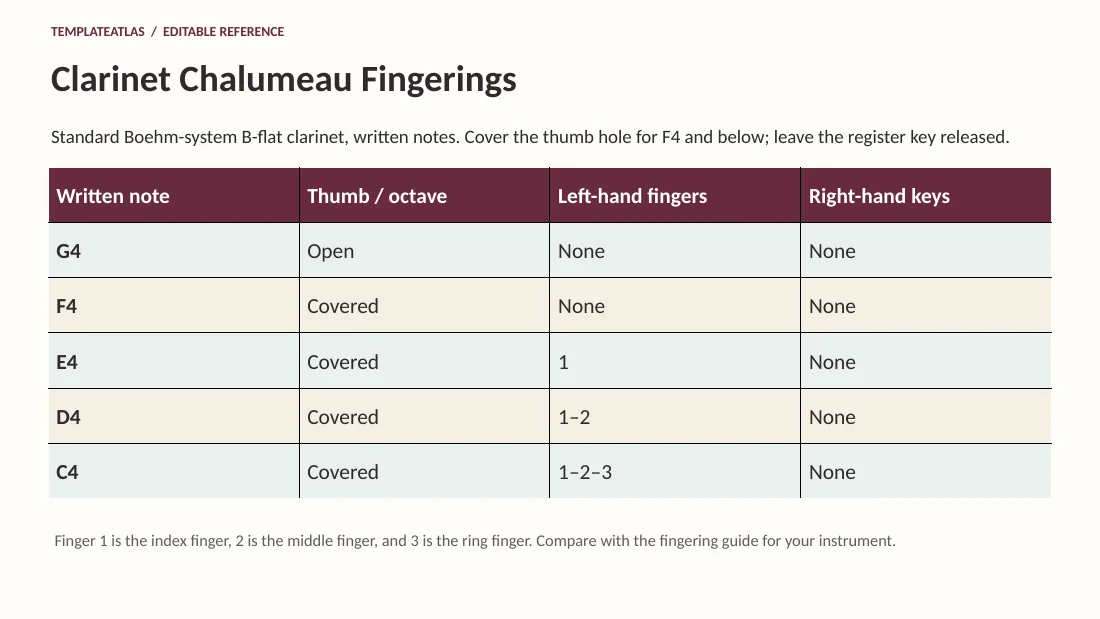
Clarinet Chalumeau Fingerings
Standard Boehm-system B-flat clarinet, written notes. Cover the thumb hole for F4 and below; leave the register key released.
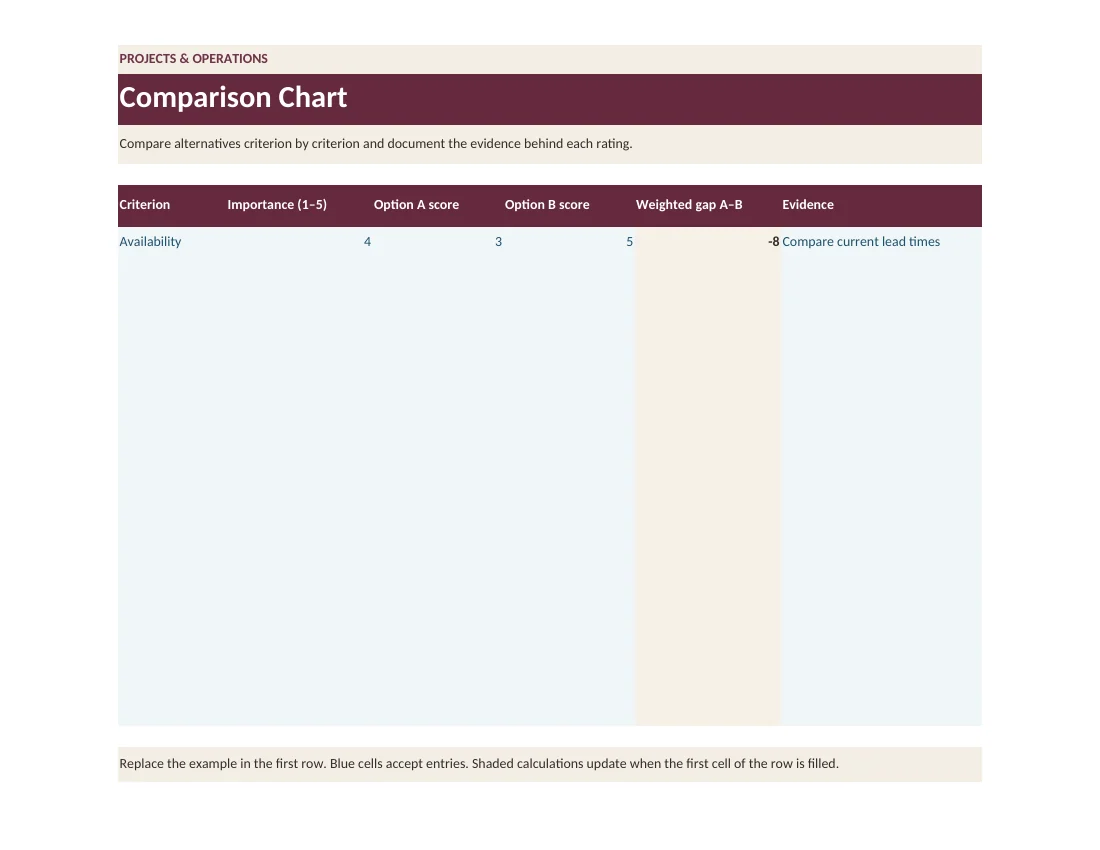
Comparison Chart
Compare alternatives criterion by criterion and document the evidence behind each rating.
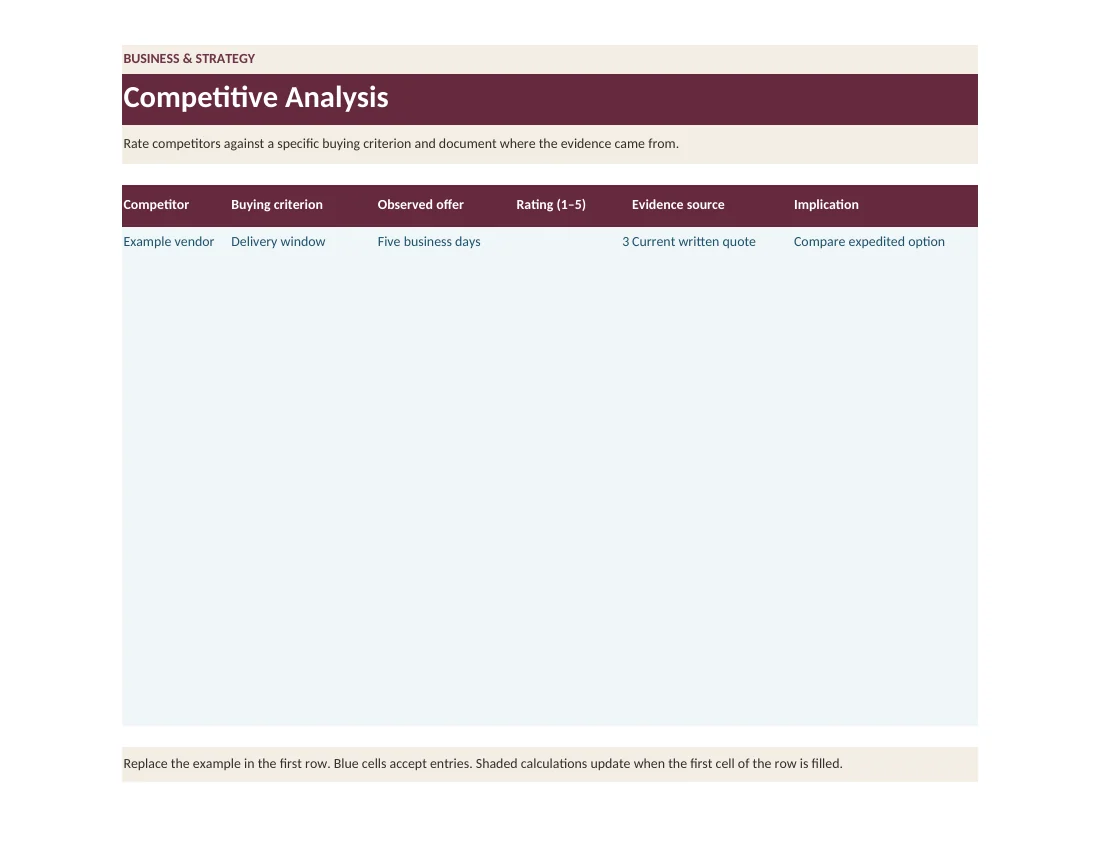
Competitive Analysis
Rate competitors against a specific buying criterion and document where the evidence came from.
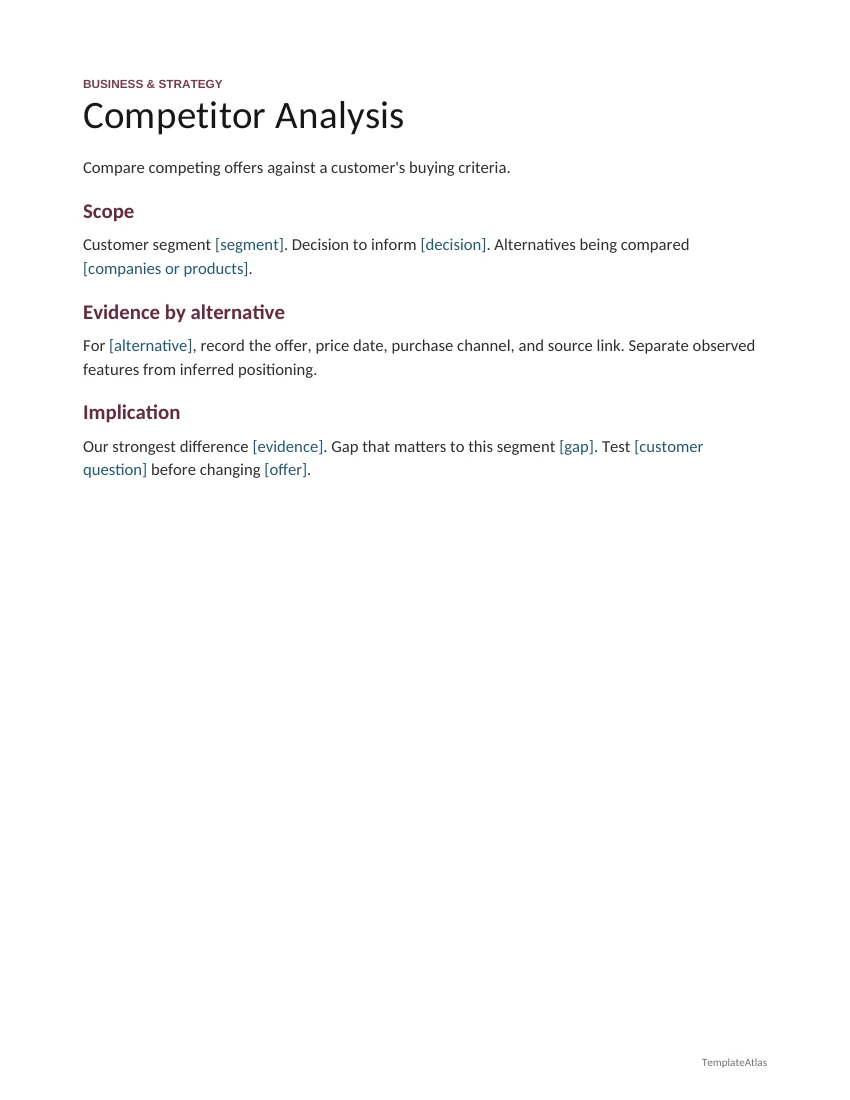
Competitor Analysis
Compare competing offers against a customer's buying criteria.
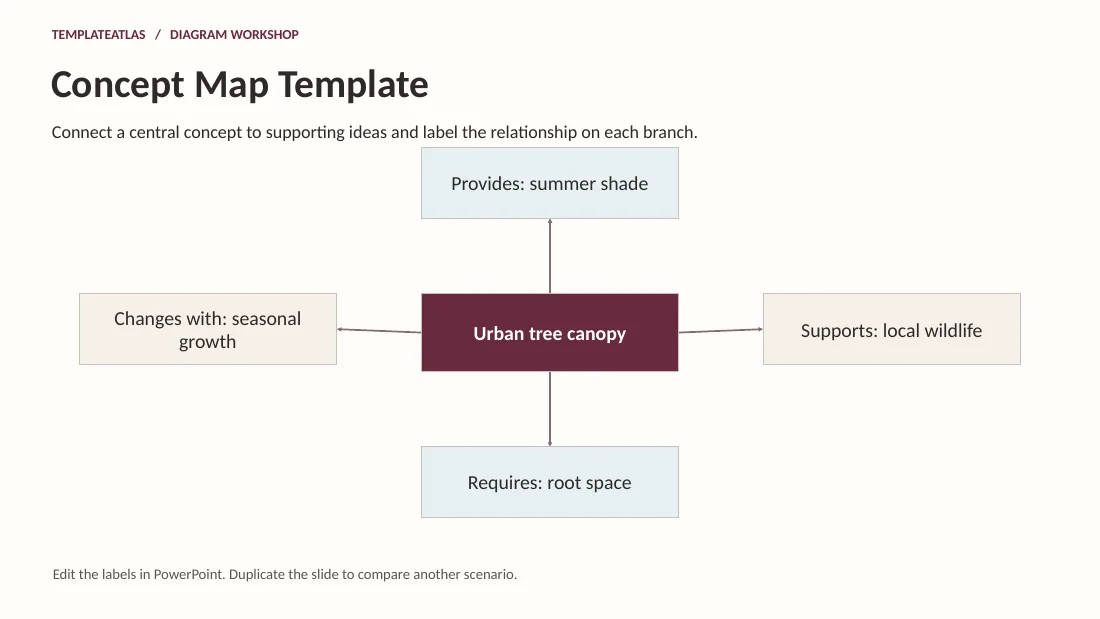
Concept Map Template
Connect a central concept to supporting ideas and label the relationship on each branch.
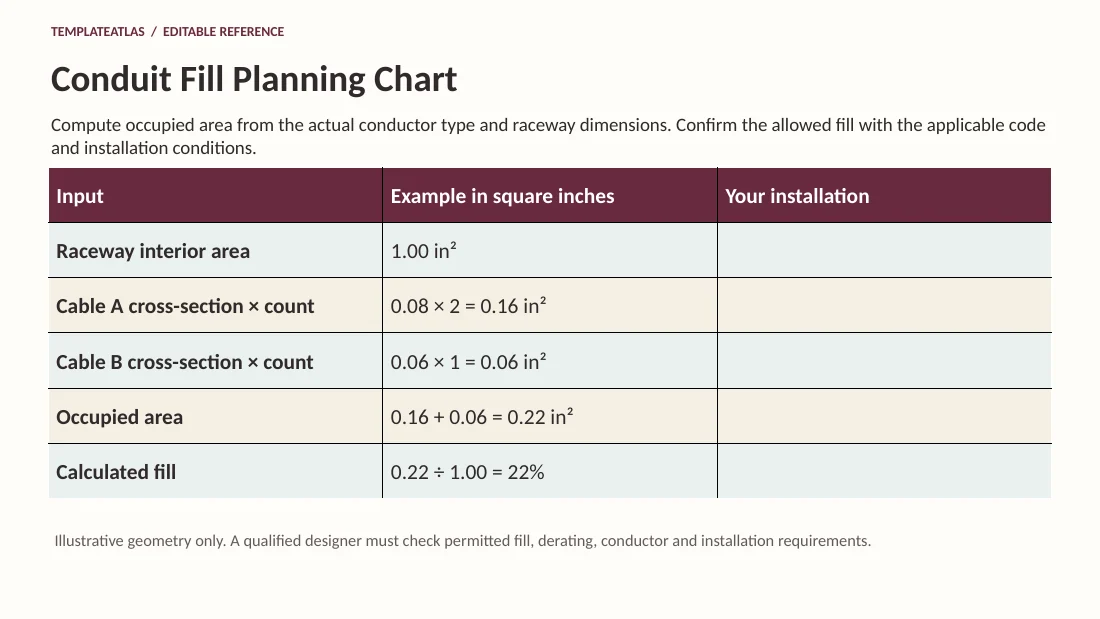
Conduit Fill Planning Chart
Compute occupied area from the actual conductor type and raceway dimensions. Confirm the allowed fill with the applicable code and installation conditions.
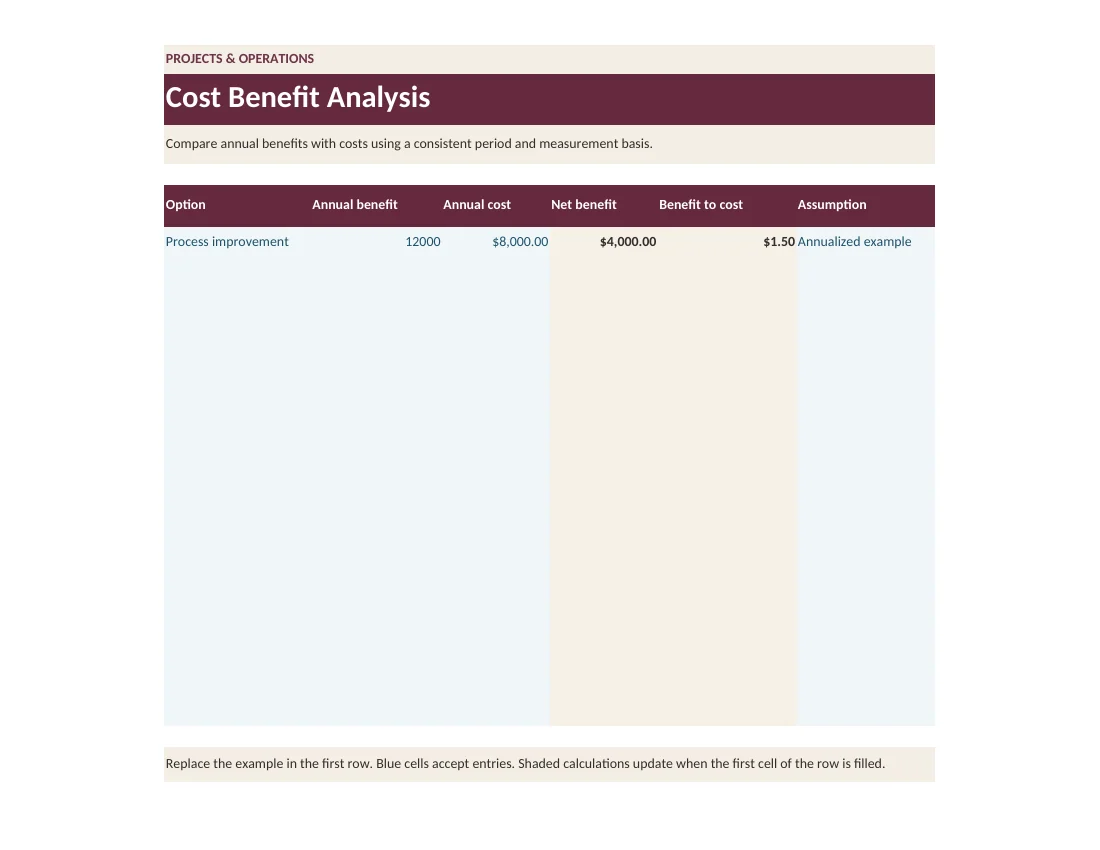
Cost Benefit Analysis
Compare annual benefits with costs using a consistent period and measurement basis.
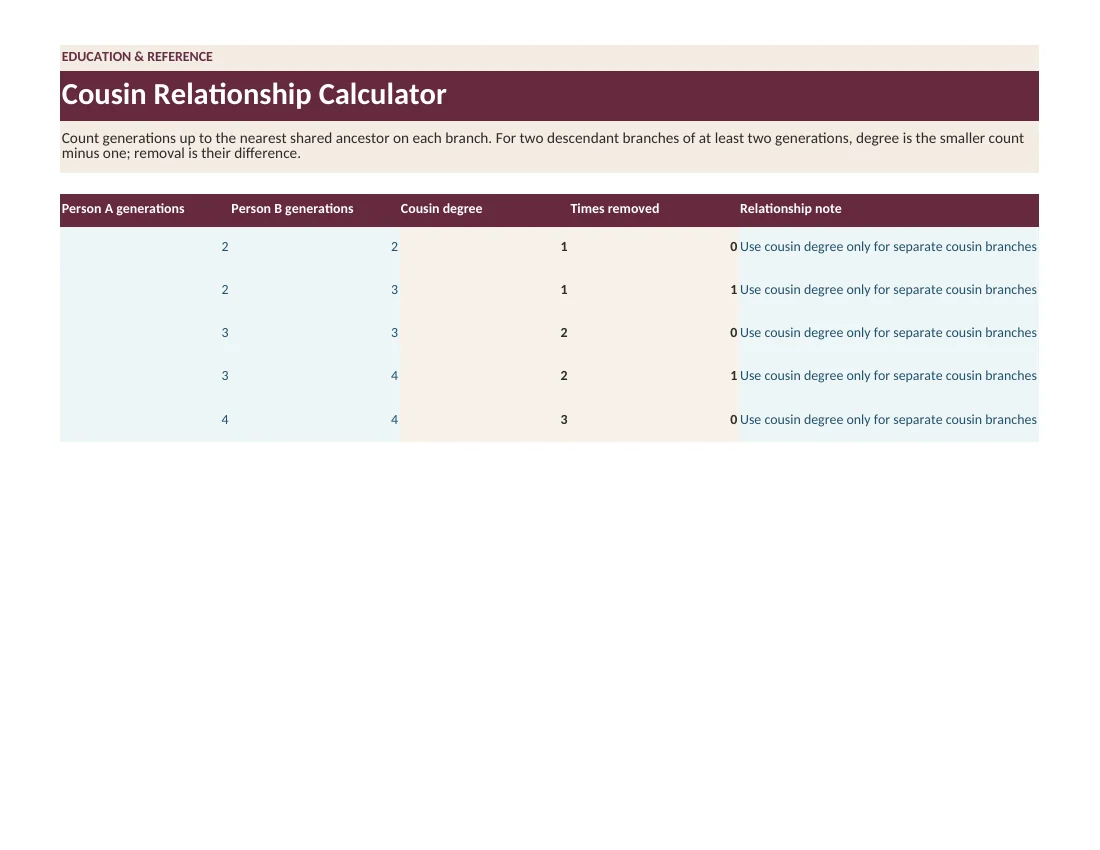
Cousin Relationship Calculator
Count generations up to the nearest shared ancestor on each branch. For two descendant branches of at least two generations, degree is the smaller count minus one; removal is their difference.
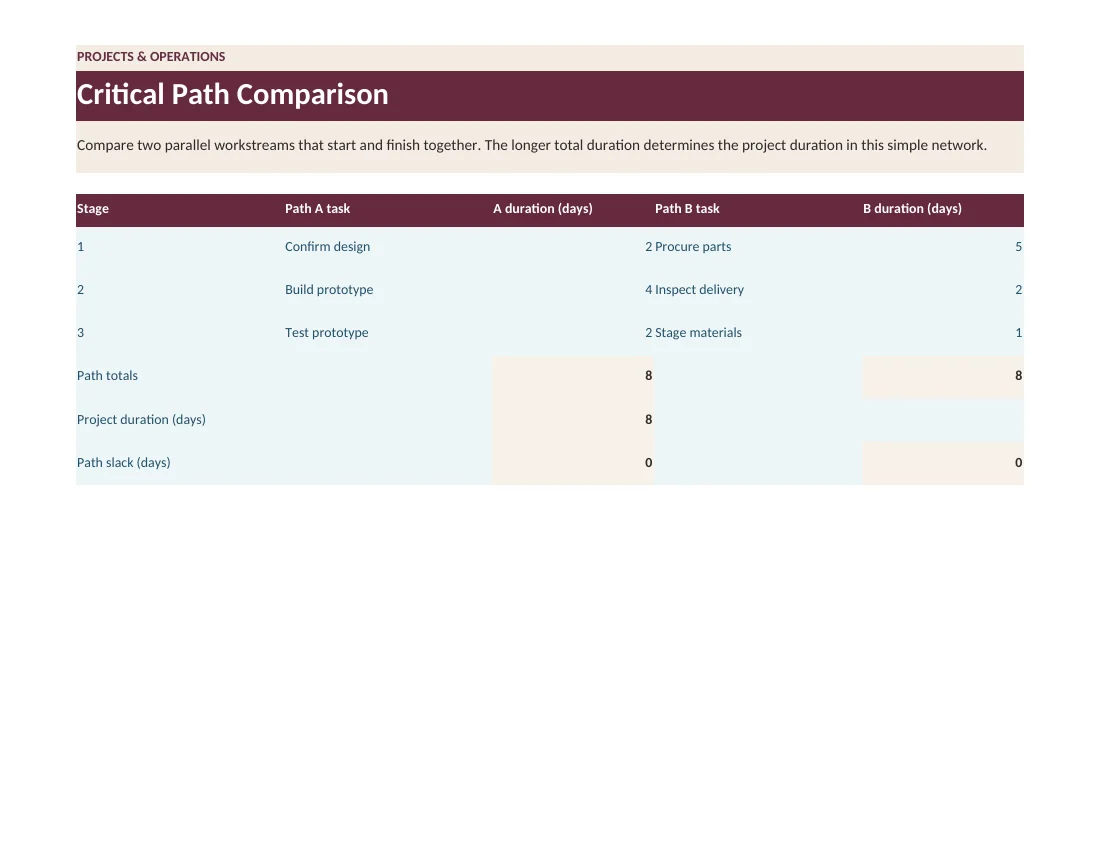
Critical Path Comparison
Compare two parallel workstreams that start and finish together. The longer total duration determines the project duration in this simple network.
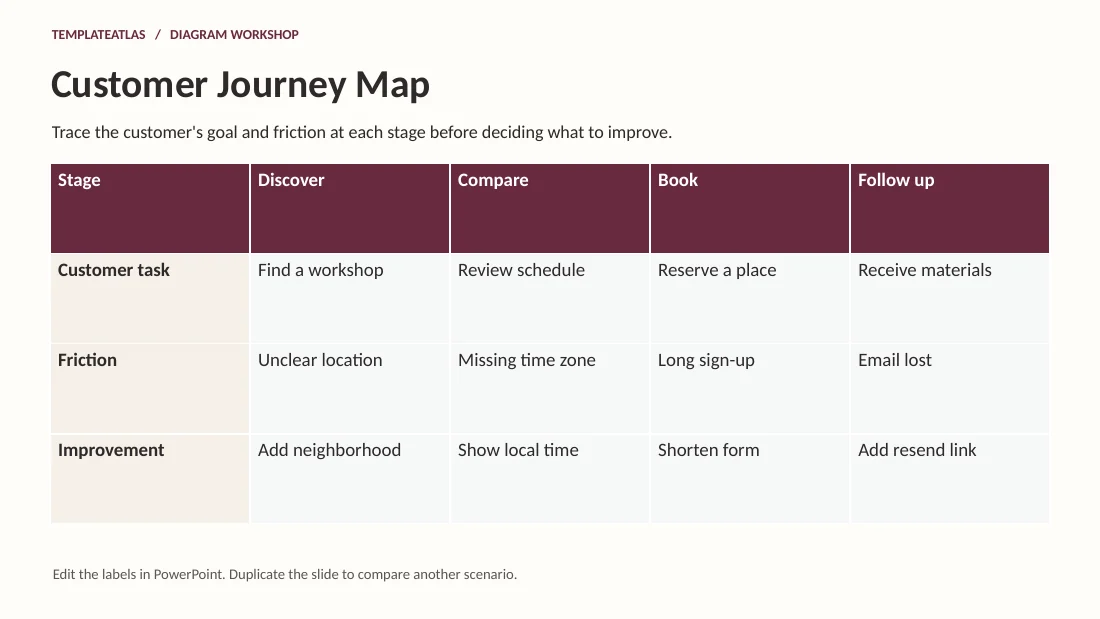
Customer Journey Map
Trace the customer's goal and friction at each stage before deciding what to improve.
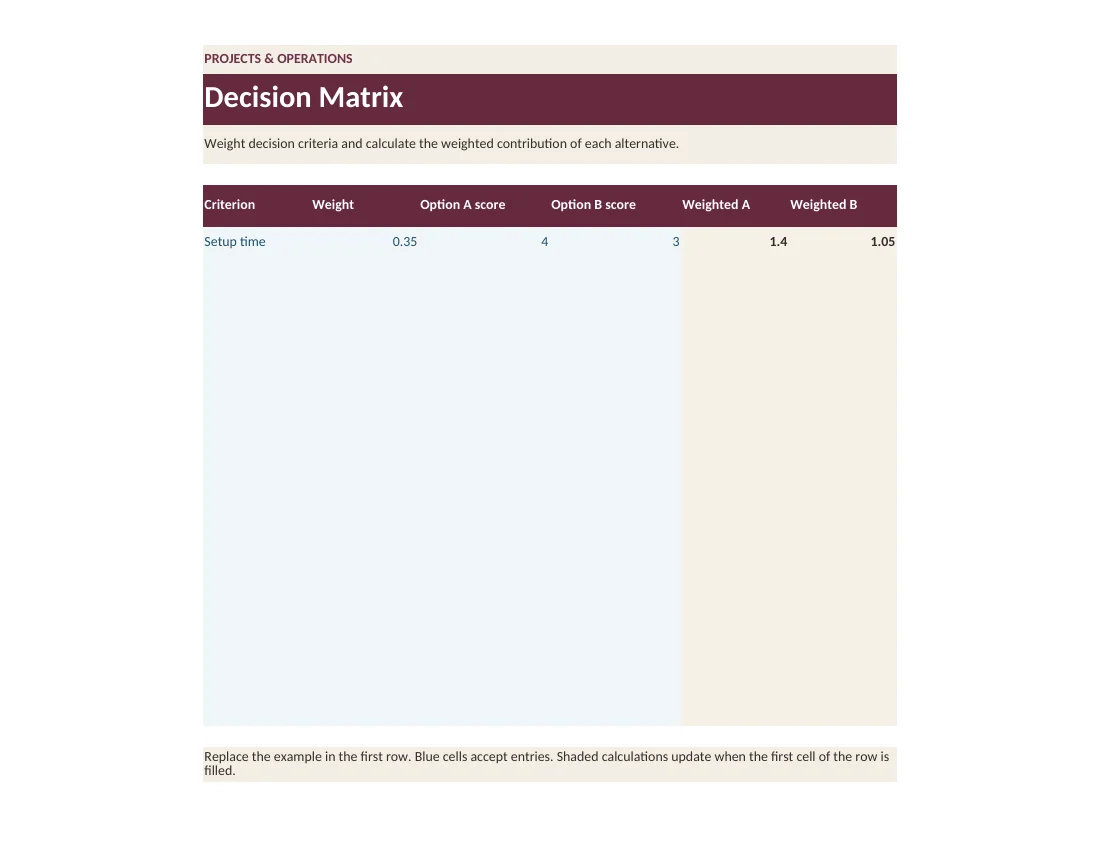
Decision Matrix
Weight decision criteria and calculate the weighted contribution of each alternative.
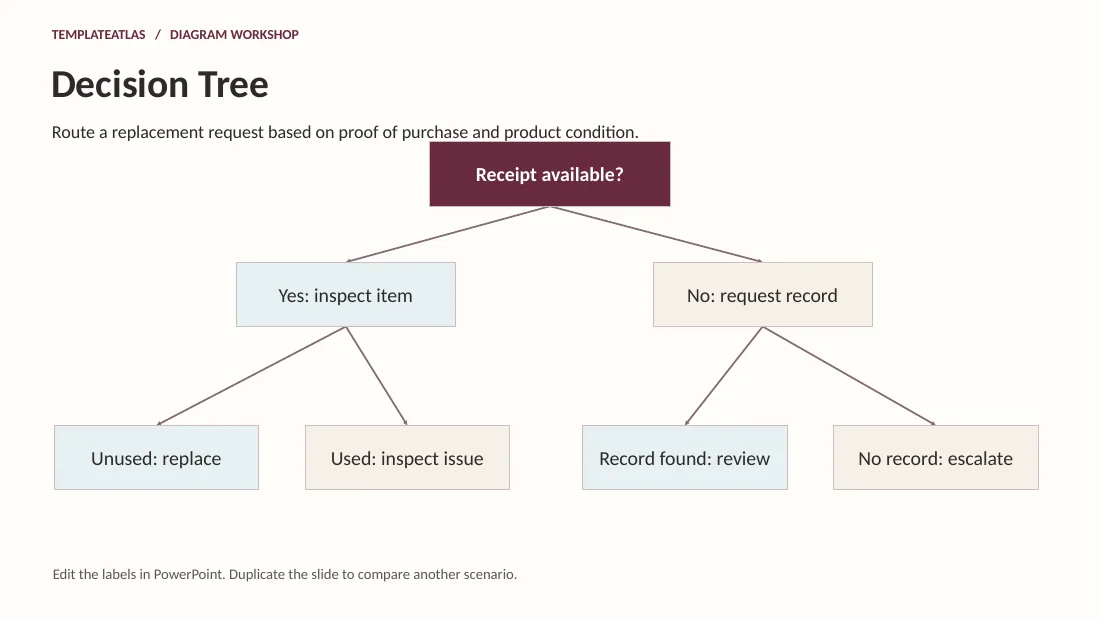
Decision Tree
Route a replacement request based on proof of purchase and product condition.
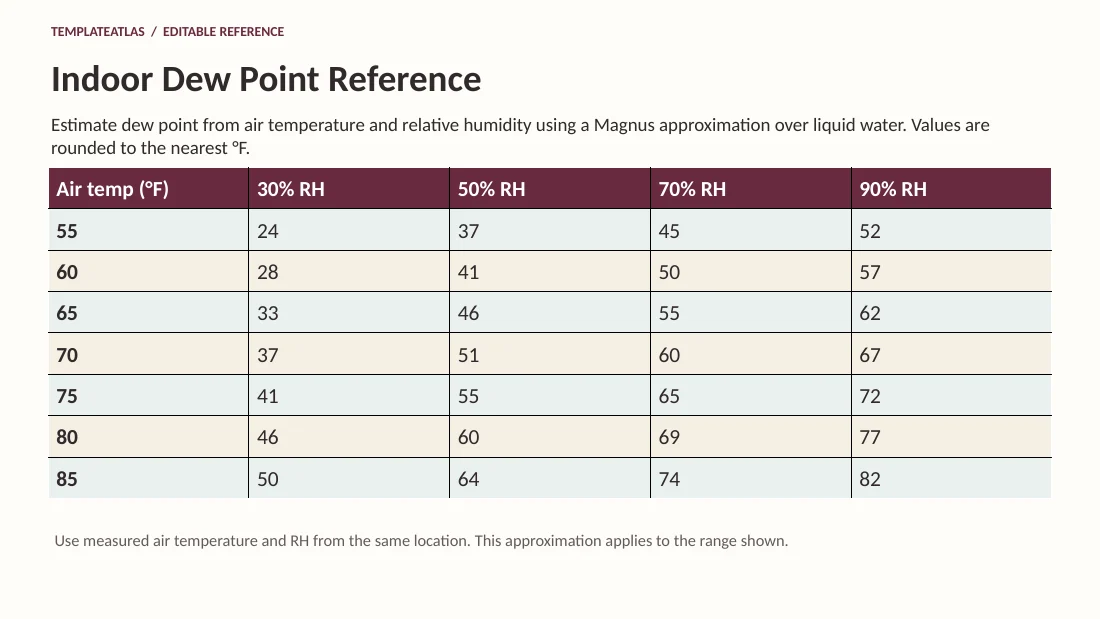
Indoor Dew Point Reference
Estimate dew point from air temperature and relative humidity using a Magnus approximation over liquid water. Values are rounded to the nearest °F.
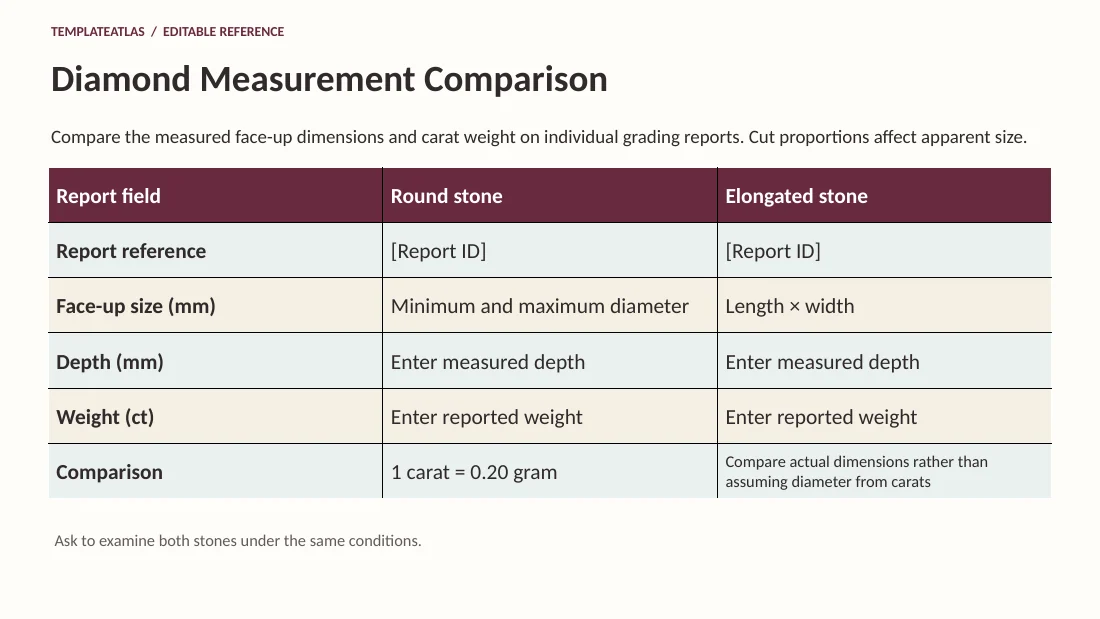
Diamond Measurement Comparison
Compare the measured face-up dimensions and carat weight on individual grading reports. Cut proportions affect apparent size.