
Copper Molecule and Curve
R-134a SI Overview Chart — Copper Molecule and Curve
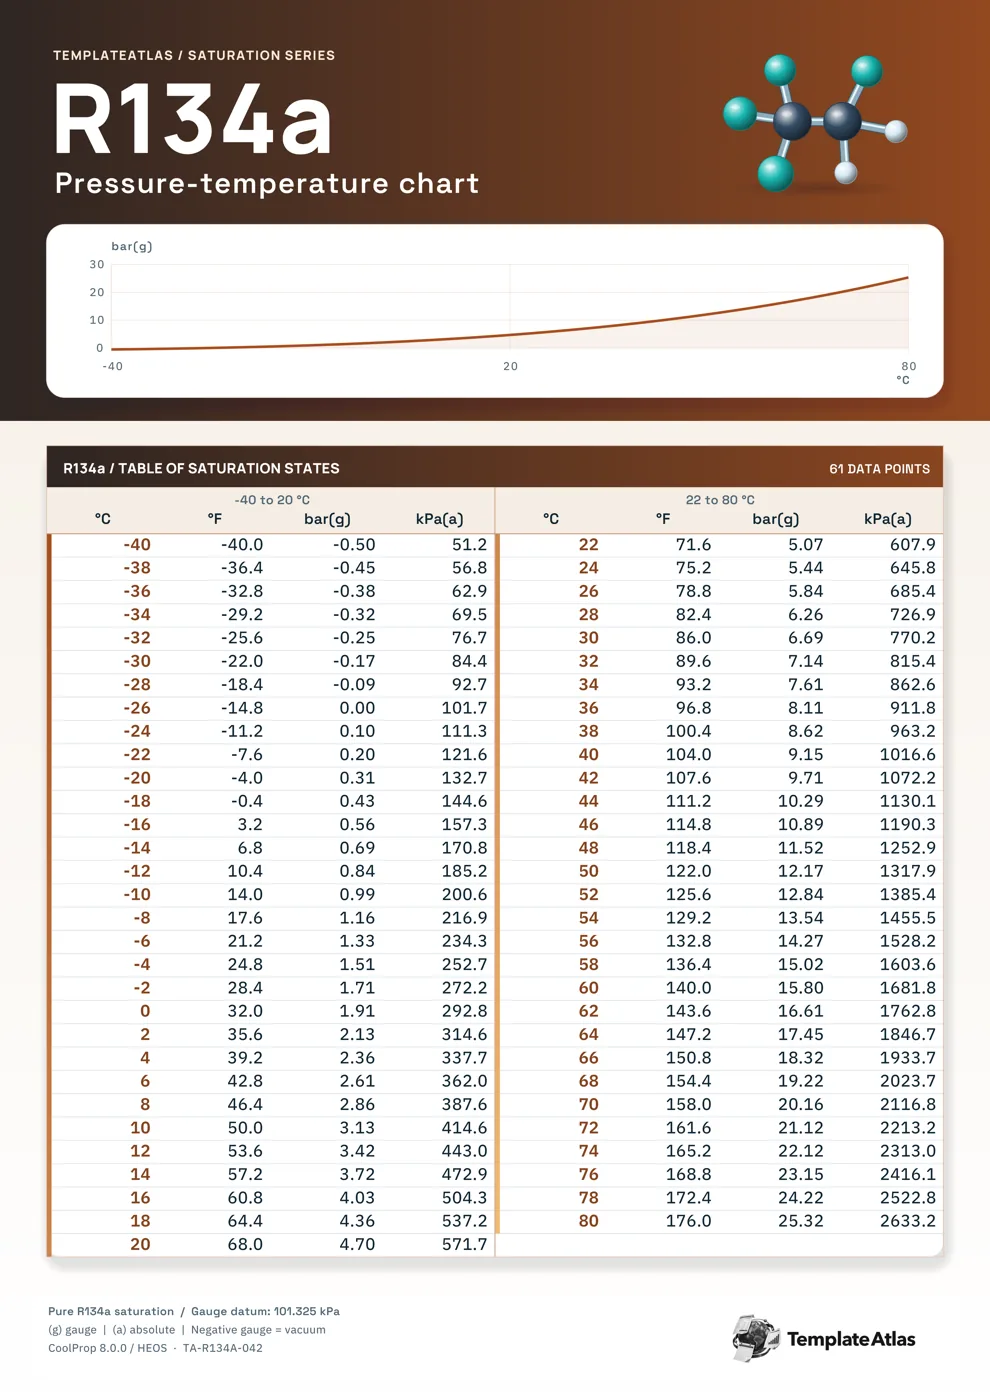
A molecular model shares the copper heading with a Celsius-based saturation curve above the numeric table.
Start with the Celsius column to find an R-134a saturation temperature, then read across for the equivalent Fahrenheit temperature and pressure. Its 2°C spacing is useful when you want a broad metric reference on one sheet. This copper molecule and curve version covers -40 to 80°C in 2°C steps.
The small curve shows the overall pressure-temperature trend; use the table below it to read the listed values for individual reference points. The 61 listed reference points use Celsius, Fahrenheit, bar gauge, kPa absolute.
Using this reference
The PDF preserves the one-page print layout. The matching Image is a full-resolution WebP rendering. These are finished reference sheets with fixed data and illustrations.
Gauge pressure uses a 101.325 kPa atmospheric reference. Saturation values describe the refrigerant relationship; equipment instructions determine operating and charging targets.
File checksums
PDF SHA-256bf35abb6df4e506ba1dfe8650a7cb48f85d8c0ce8ad5c5785c1360b0abb2da20
WEBP SHA-256a4bf16b9ac3d2888da3eb1cc3f59dd5789b63d7359ed33a2e7039849063b0b33
Data, sources, and credits
This collection uses CoolProp 8.0.0 / HEOS R-134a saturation data. The supplied method records comparisons with Arkema and Chemours reference tables.