
Blue Molecule and Curve
R-134a SI Detailed Chart — Blue Molecule and Curve
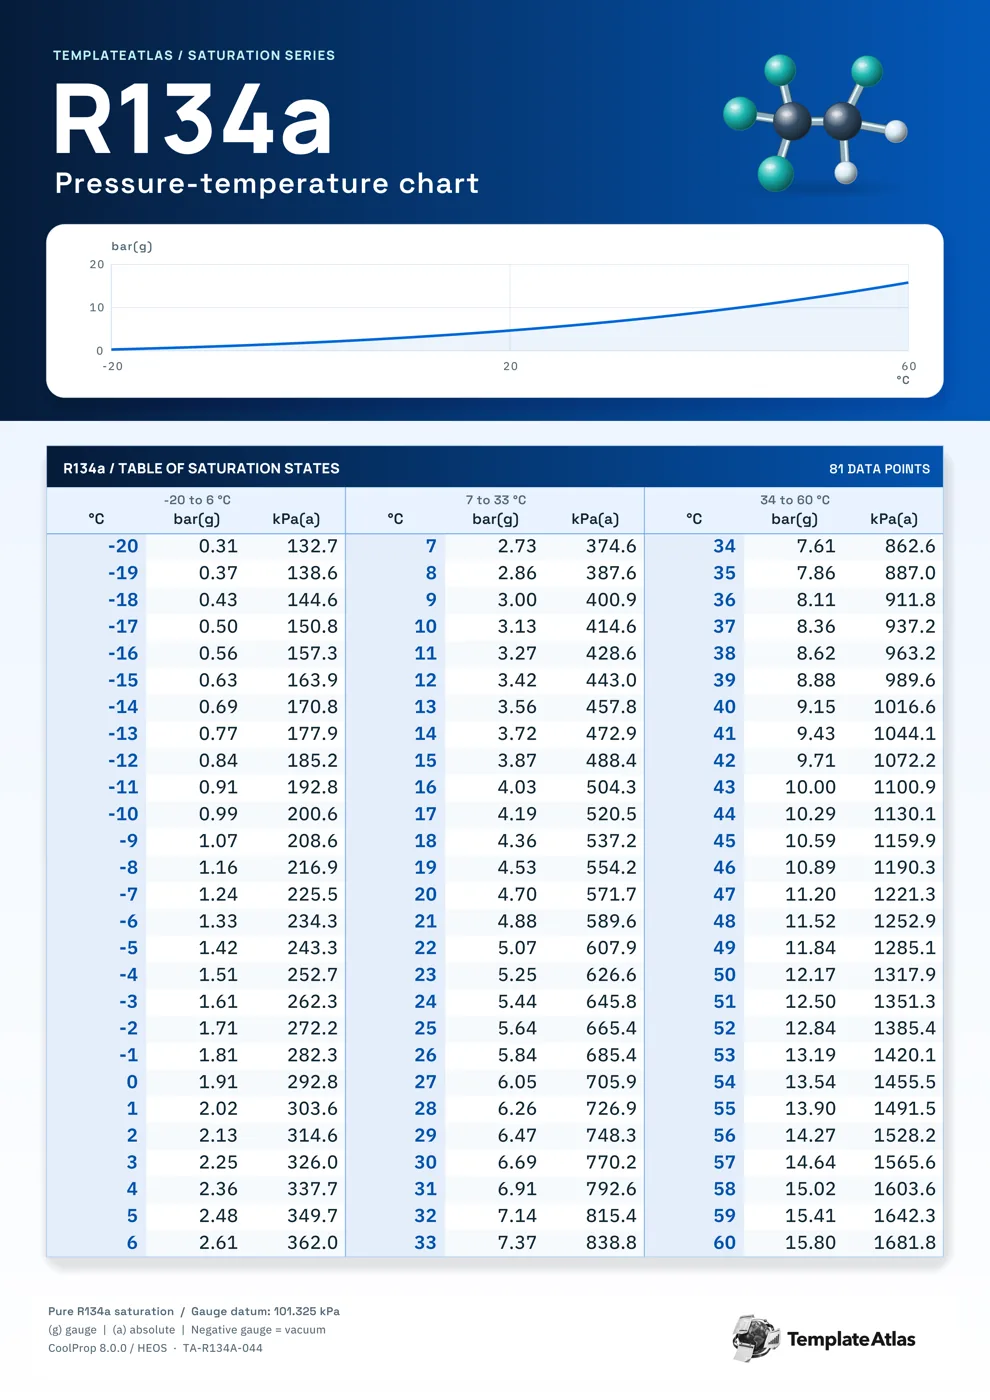
A molecular illustration and blue saturation curve appear above three sections of detailed Celsius readings.
Use this sheet when you need an R-134a reference at 1°C intervals. Read across a Celsius row to compare gauge pressure in bar with absolute pressure in kPa; those pressure columns use different reference points. This blue molecule and curve version covers -20 to 60°C in 1°C steps.
The small curve shows the overall pressure-temperature trend; use the table below it to read the listed values for individual reference points. The 81 listed reference points use Celsius, bar gauge, kPa absolute.
Using this reference
The PDF preserves the one-page print layout. The matching Image is a full-resolution WebP rendering. These are finished reference sheets with fixed data and illustrations.
Gauge pressure uses a 101.325 kPa atmospheric reference. Saturation values describe the refrigerant relationship; equipment instructions determine operating and charging targets.
File checksums
PDF SHA-256f2523f7ab96f5f7ac3e5d9f22556b3868045b427a545791d5f7da6a6aedc0f99
WEBP SHA-256b308734c7551bedea116c4002c30b86208089ac659e26445e7fd3c902c35cab1
Data, sources, and credits
This collection uses CoolProp 8.0.0 / HEOS R-134a saturation data. The supplied method records comparisons with Arkema and Chemours reference tables.