
Blue Table-First Molecule
R-134a US Overview Chart — Blue Table-First Molecule
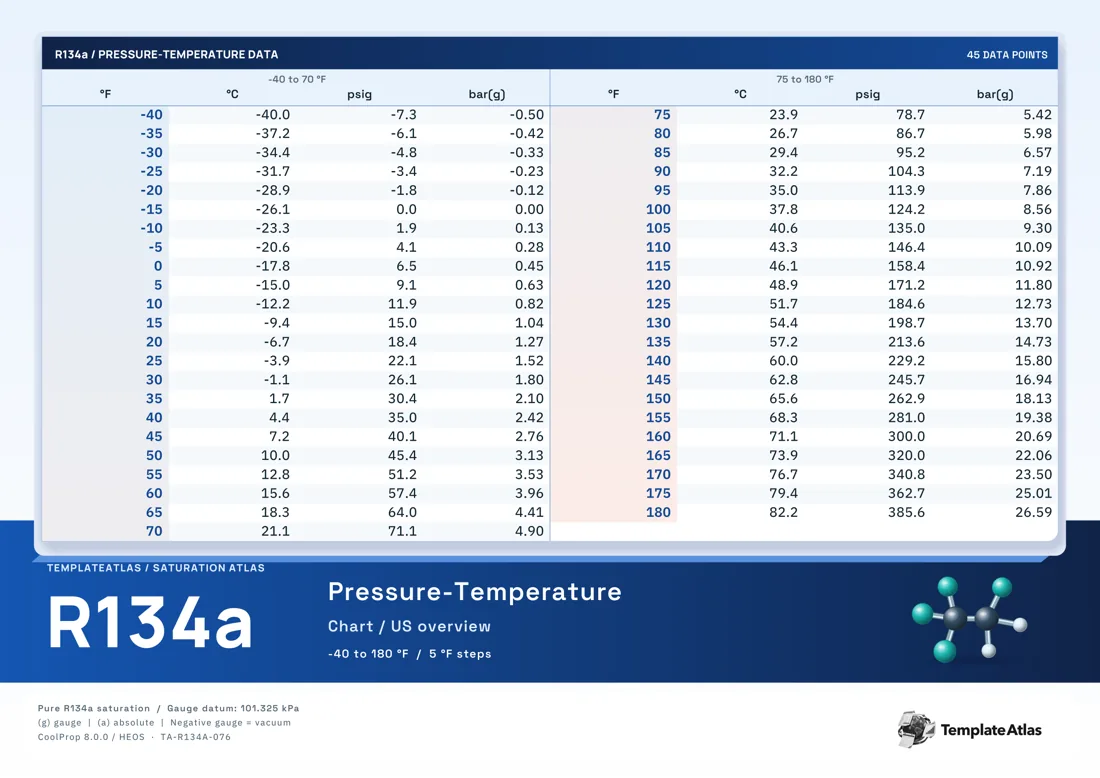
The overview table fills the upper page, with the title and molecular model placed in a blue band underneath.
Use this chart to look up the saturation pressure of R-134a from a Fahrenheit temperature, then compare the equivalent Celsius reading on the same row. The 5°F spacing gives a broad overview rather than the finer steps of the detailed edition. This blue table-first molecule version covers -40 to 180°F in 5°F steps.
This table-first layout puts the readings at the top and moves the title and molecular illustration into a lower band. The 45 listed reference points use Fahrenheit, Celsius, psi gauge, bar gauge.
Using this reference
The PDF preserves the one-page print layout. The matching Image is a full-resolution WebP rendering. These are finished reference sheets with fixed data and illustrations.
Gauge pressure uses a 101.325 kPa atmospheric reference. Saturation values describe the refrigerant relationship; equipment instructions determine operating and charging targets.
File checksums
PDF SHA-256806fcca64c04a3cfcfbbb8f7f3c3883f7d75179b24c8c4259691aebe2a5eb7c8
WEBP SHA-256e5618d2fb621b98498513a0c6950255c70c7ebefc9e02728d8ecc95b2ff74f48
Data, sources, and credits
This collection uses CoolProp 8.0.0 / HEOS R-134a saturation data. The supplied method records comparisons with Arkema and Chemours reference tables.