
Orange Thermometer Landscape
R-134a US Detailed Chart — Orange Thermometer Landscape
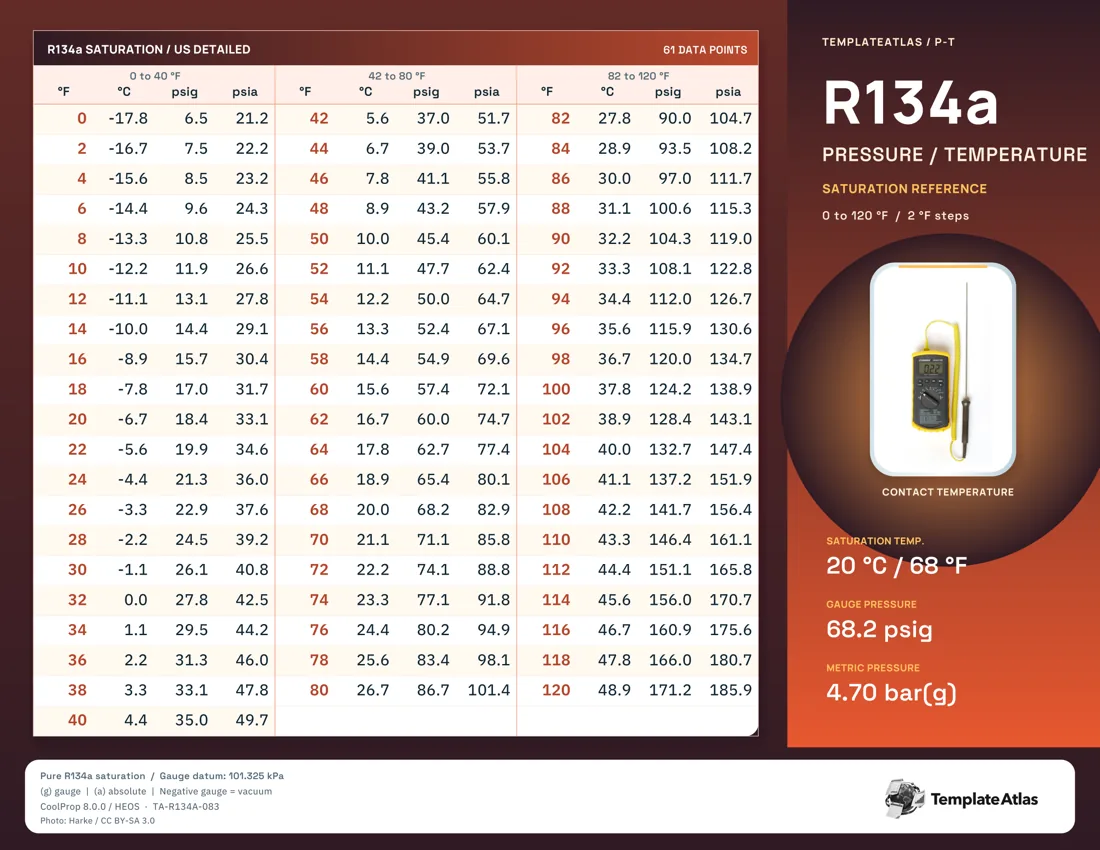
A yellow thermometer sits in the orange right sidebar, next to three blocks of detailed Fahrenheit readings.
This chart gives a closer-spaced view of the R-134a pressure-temperature relationship, using 2°F increments. Follow a Fahrenheit row across to compare its Celsius equivalent with both gauge pressure and absolute pressure in psi. This orange thermometer landscape version covers 0 to 120°F in 2°F steps.
The equipment and reference-state panel sits on the right, leaving the landscape table together on the left. The 61 listed reference points use Fahrenheit, Celsius, psi gauge, psi absolute.
Using this reference
The PDF preserves the one-page print layout. The matching Image is a full-resolution WebP rendering. These are finished reference sheets with fixed data and illustrations.
Gauge pressure uses a 101.325 kPa atmospheric reference. Saturation values describe the refrigerant relationship; equipment instructions determine operating and charging targets.
File checksums
PDF SHA-2562c290975157cae9830ebe90382b5f7ef9e99ebea31221bddb964d2a1ed33d962
WEBP SHA-2564caaee19446a5817f4a80c1527dc540c8aca9a030573d1226b4d92383d03c934
Data, sources, and credits
This collection uses CoolProp 8.0.0 / HEOS R-134a saturation data. The supplied method records comparisons with Arkema and Chemours reference tables.