 TemplateAtlas
The TemplateAtlas catalog
Charts & Graphs
Explore data visualizations, process diagrams, and reference charts. Build a chart from your own numbers in Chart Studio.
Open Chart Studio →Choose a chart to build
Bar graphPie chartLine chartArea chartStacked bar chartScatter plotBubble chartHistogramBox-and-whisker plotHeatmapPareto chartRadar chartCombo chartFunnel chartSlope chartBullet chartCash-flow chartDot plotPopulation pyramid2027 calendar heatmapBurndown chartCohort retention chartTreemap chartSunburst chartSankey diagramWaterfall chartX-bar and R control chart
Printable Reference Charts44 templatesData Visualization18 templatesBusiness & Finance Charts22 templatesProject & Process Charts31 templatesEducation & STEM Charts16 templates
In this collection
4 templates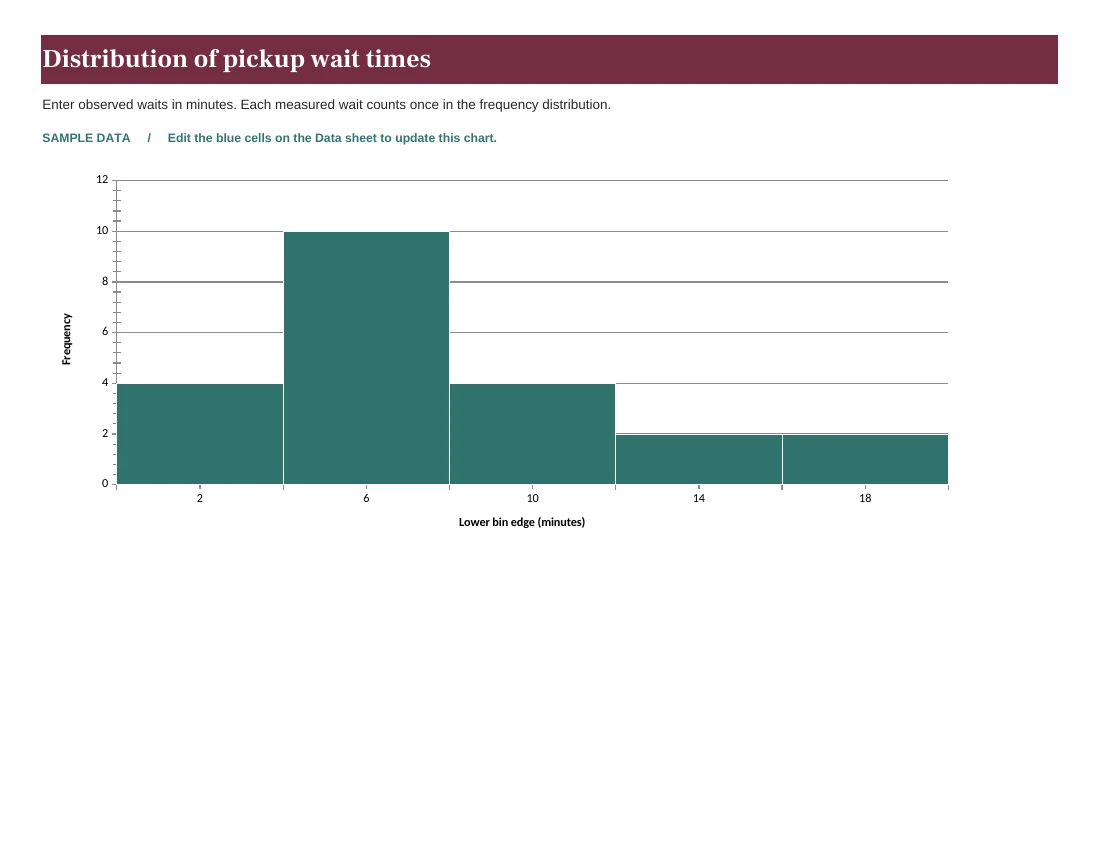
xlsx · pdf · svg · csv · jpg
Distribution of pickup wait times
Enter observed waits in minutes. Each measured wait counts once in the frequency distribution.
pptx · pdf · svg · csv · jpg
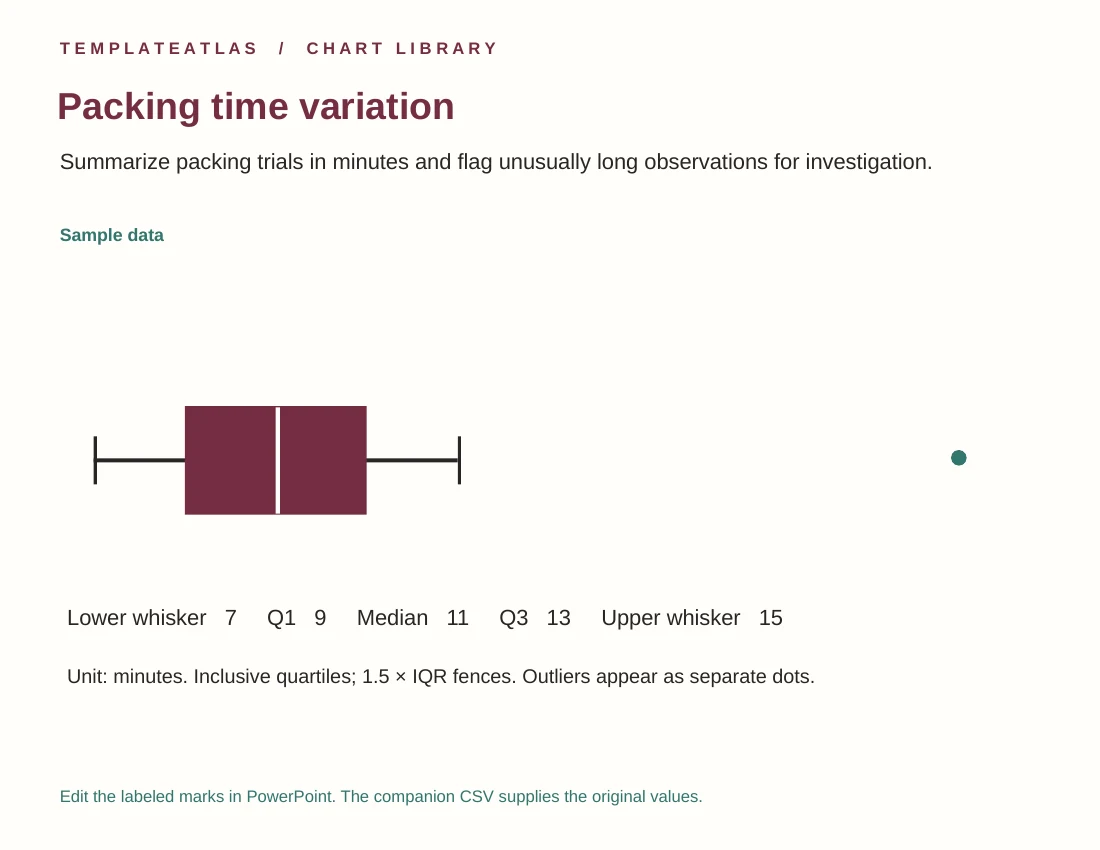
Packing time variation
Summarize packing trials in minutes and flag unusually long observations for investigation.
xlsx · pdf · svg · csv · jpg
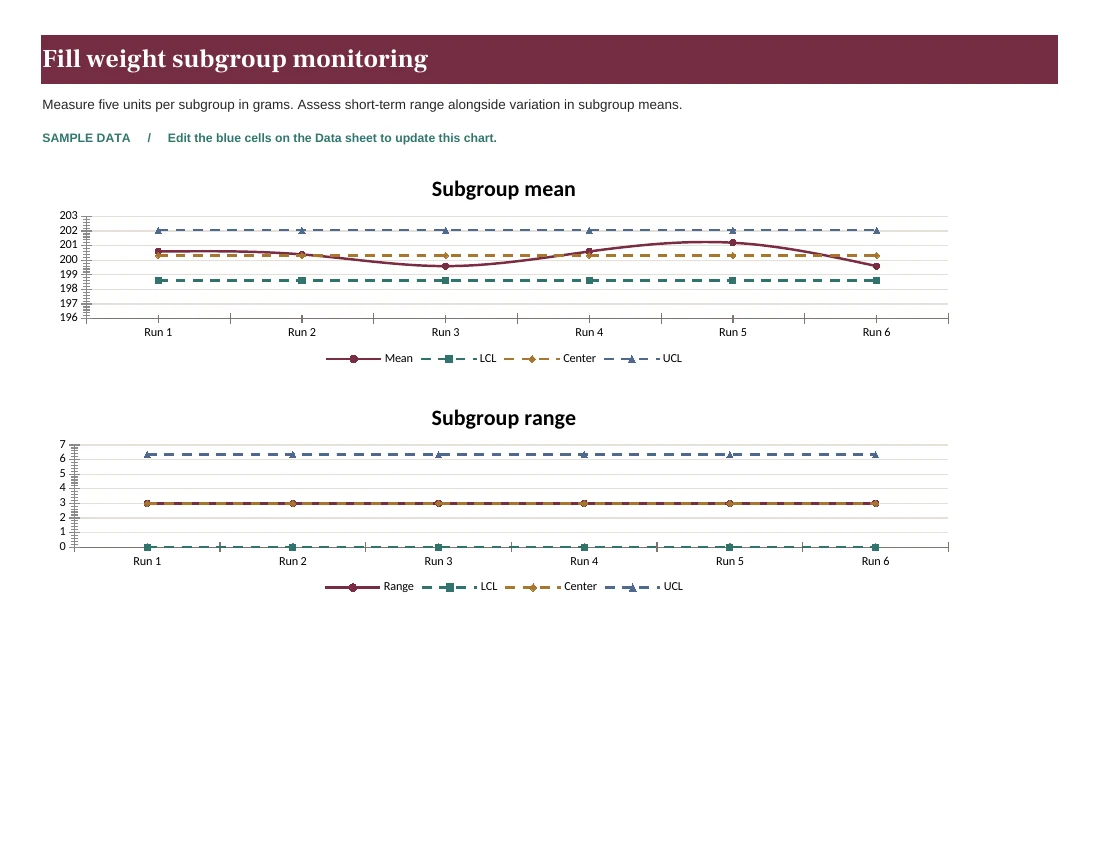
Fill weight subgroup monitoring
Measure five units per subgroup in grams. Assess short-term range alongside variation in subgroup means.
xlsx · pdf · svg · csv · jpg
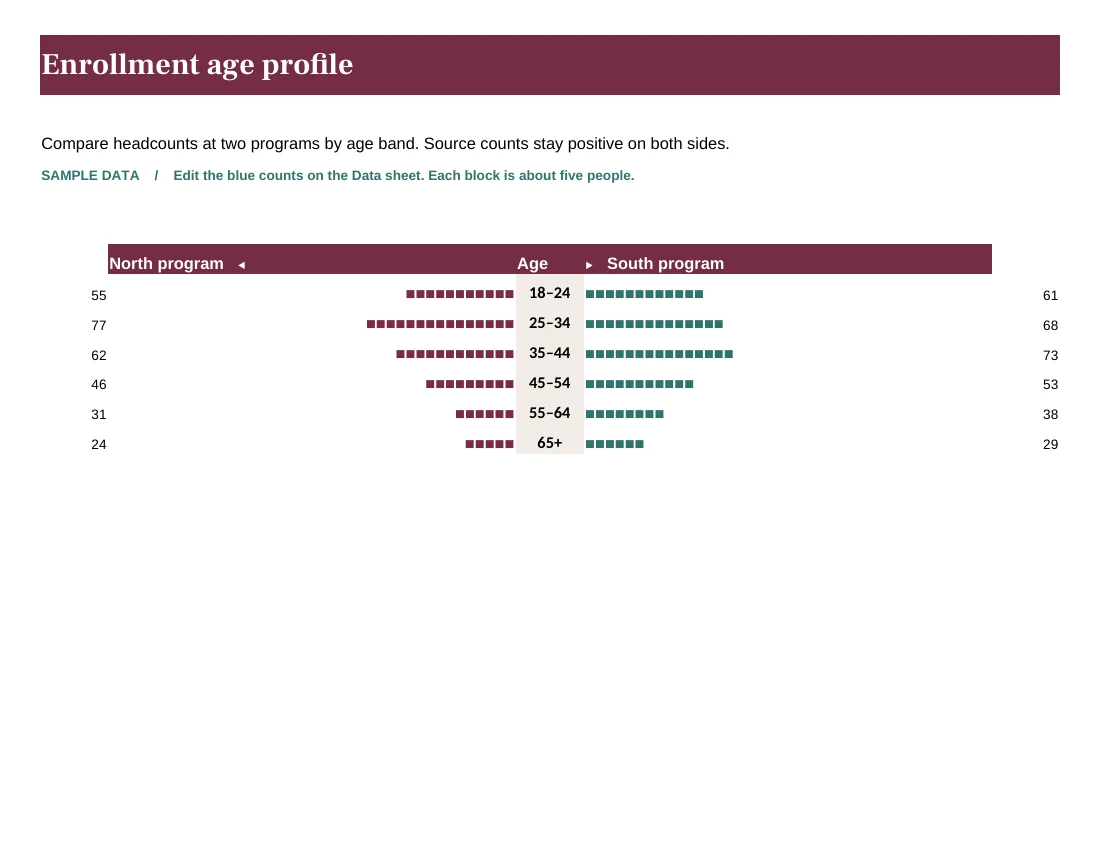
Enrollment age profile
Compare headcounts at two programs by age band. Source counts stay positive on both sides.