 TemplateAtlas
The TemplateAtlas catalog
Charts & Graphs
Explore data visualizations, process diagrams, and reference charts. Build a chart from your own numbers in Chart Studio.
Open Chart Studio →Choose a chart to build
In this collection
12 templates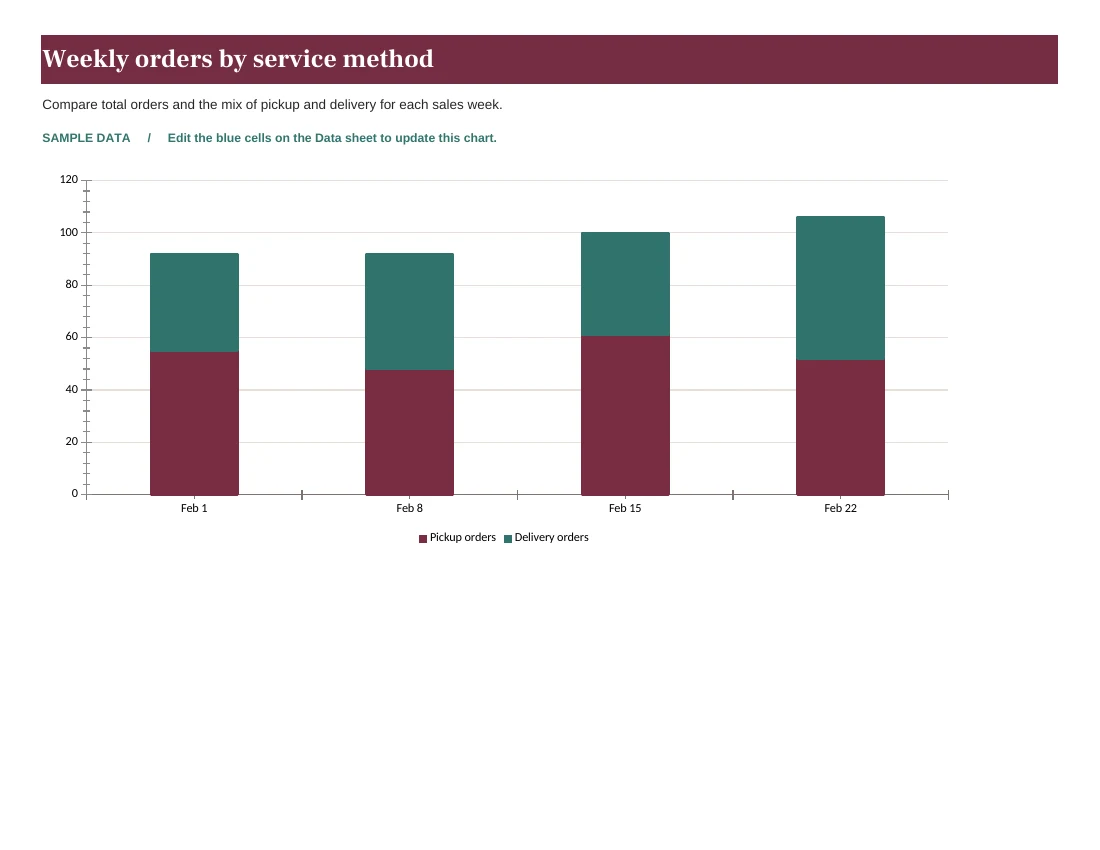
Weekly orders by service method
Compare total orders and the mix of pickup and delivery for each sales week.
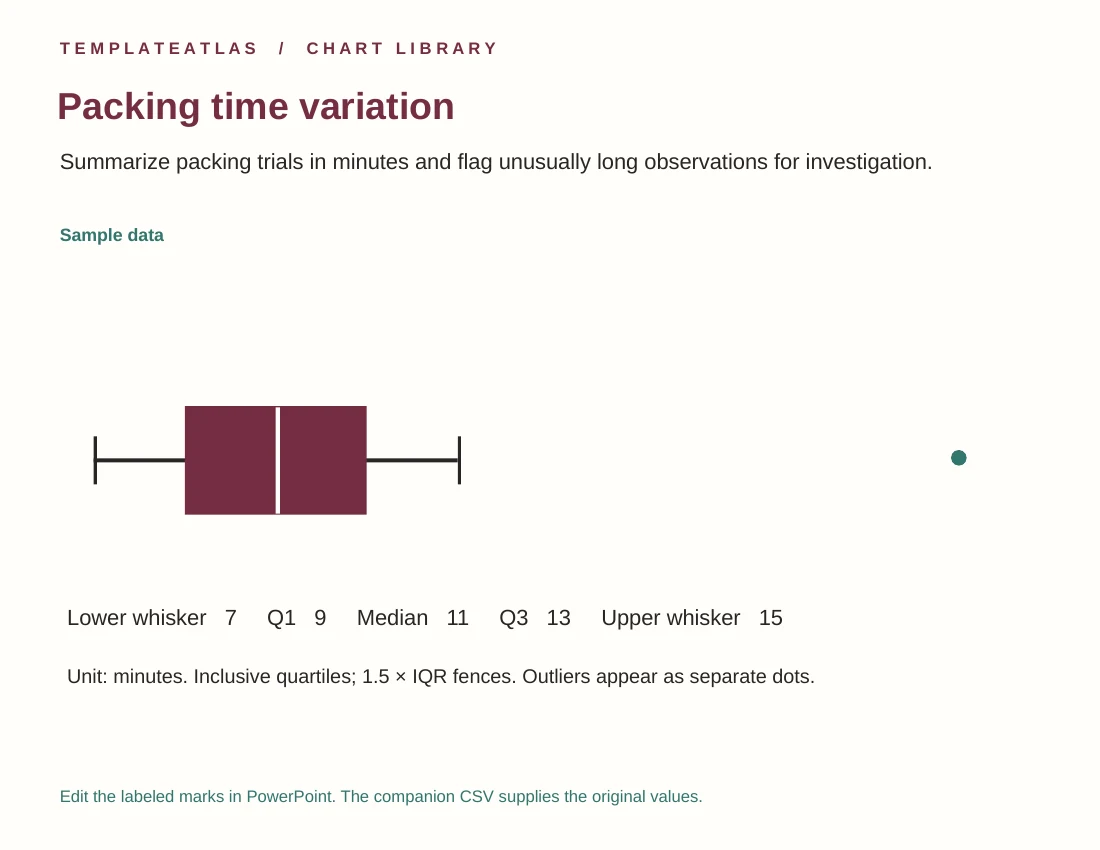
Packing time variation
Summarize packing trials in minutes and flag unusually long observations for investigation.
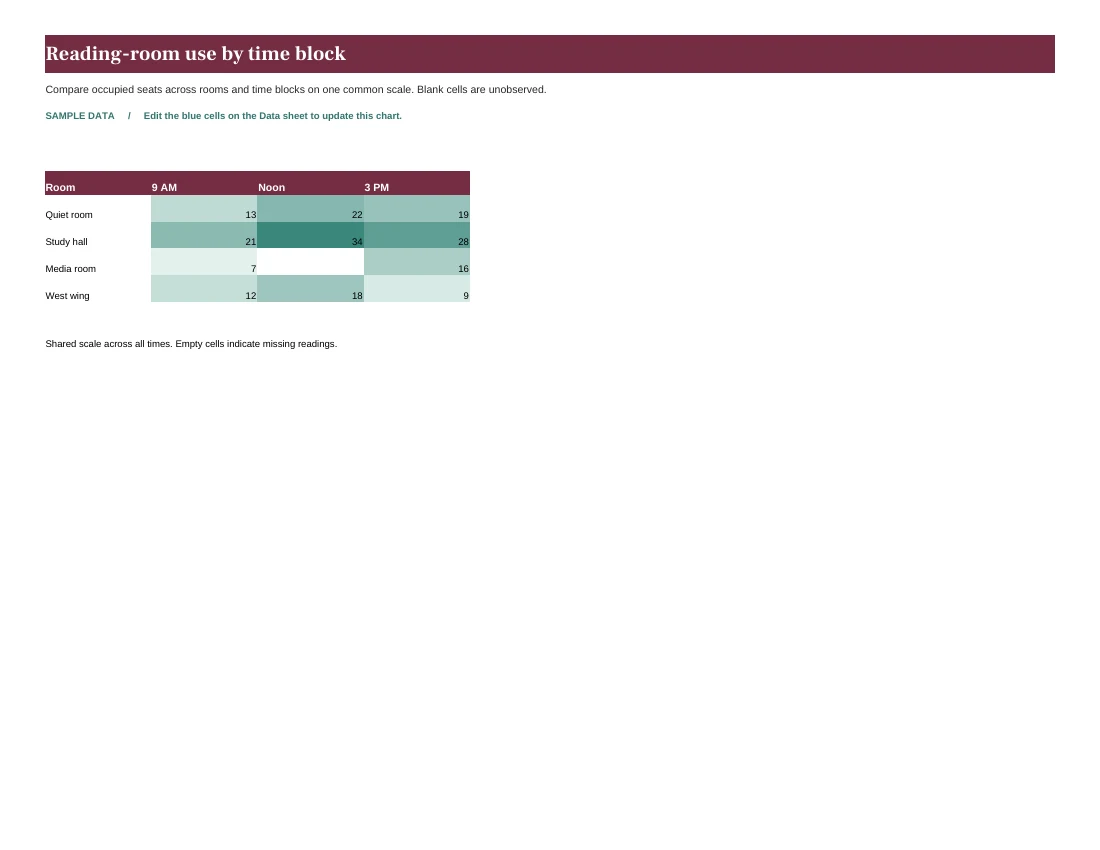
Reading-room use by time block
Compare occupied seats across rooms and time blocks on one common scale. Blank cells are unobserved.
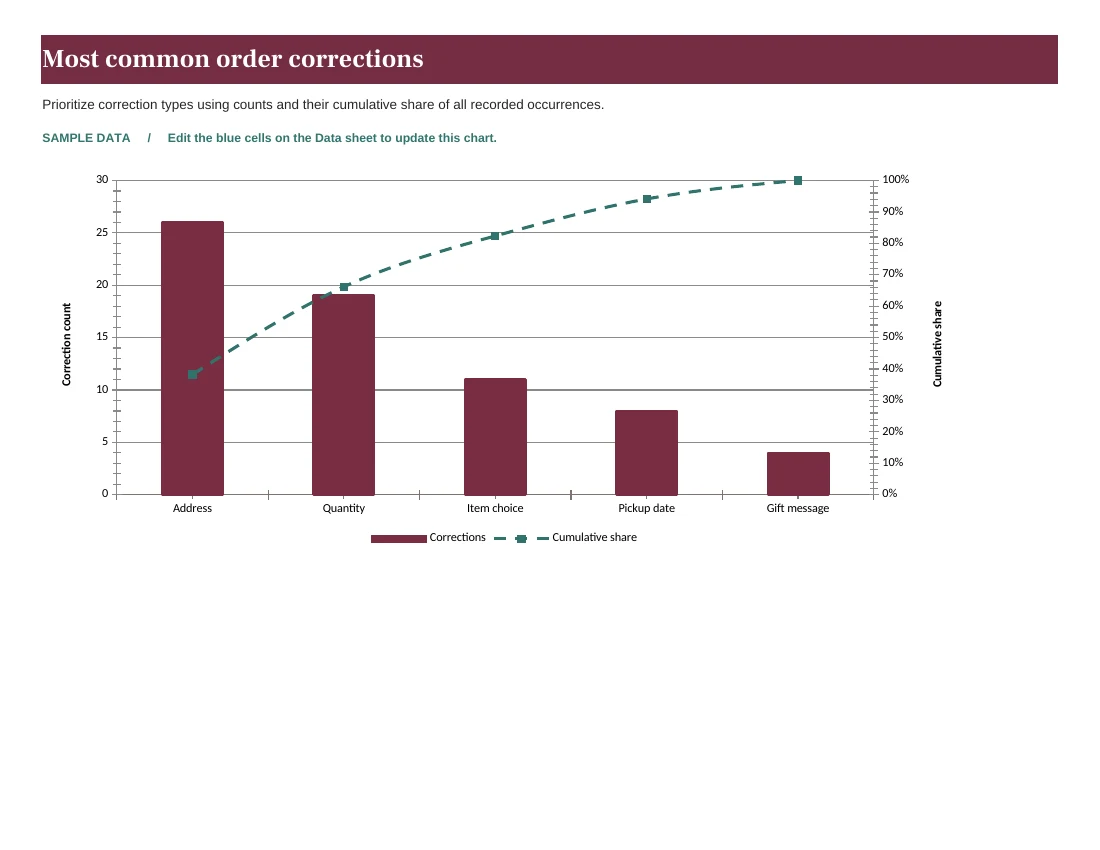
Most common order corrections
Prioritize correction types using counts and their cumulative share of all recorded occurrences.
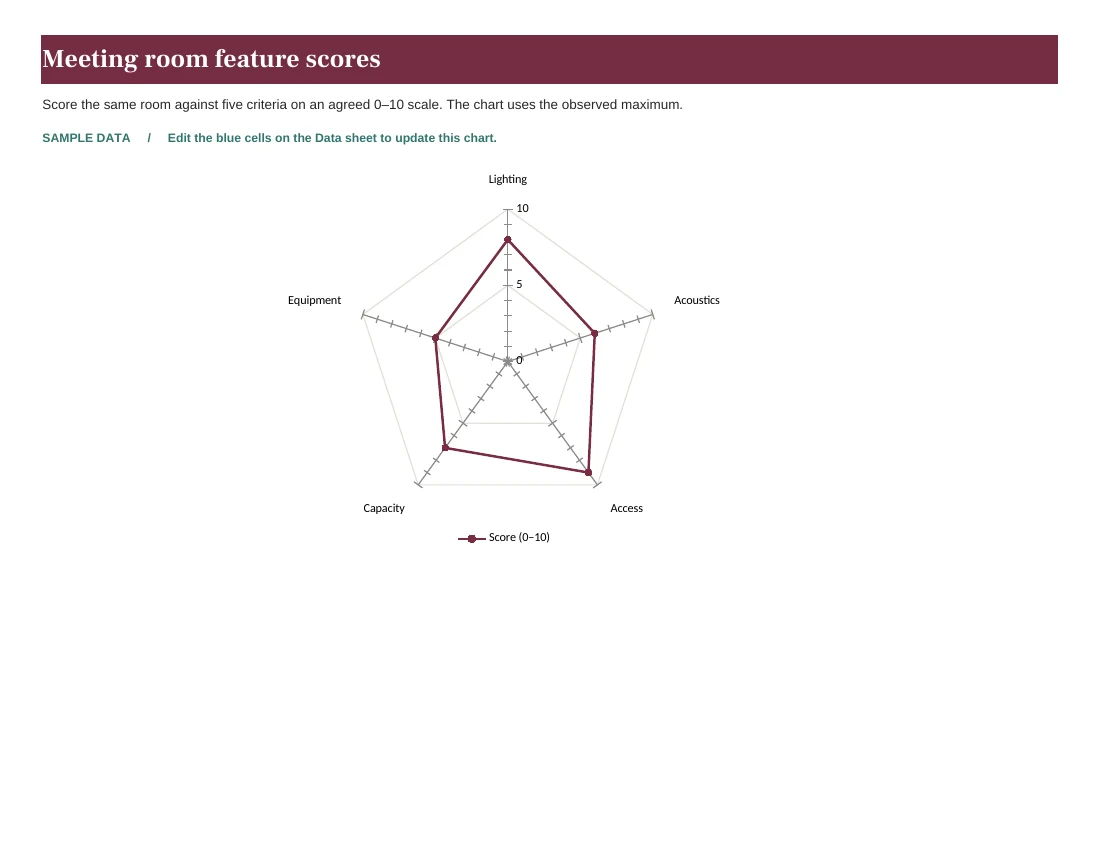
Meeting room feature scores
Score the same room against five criteria on an agreed 0–10 scale. The chart uses the observed maximum.
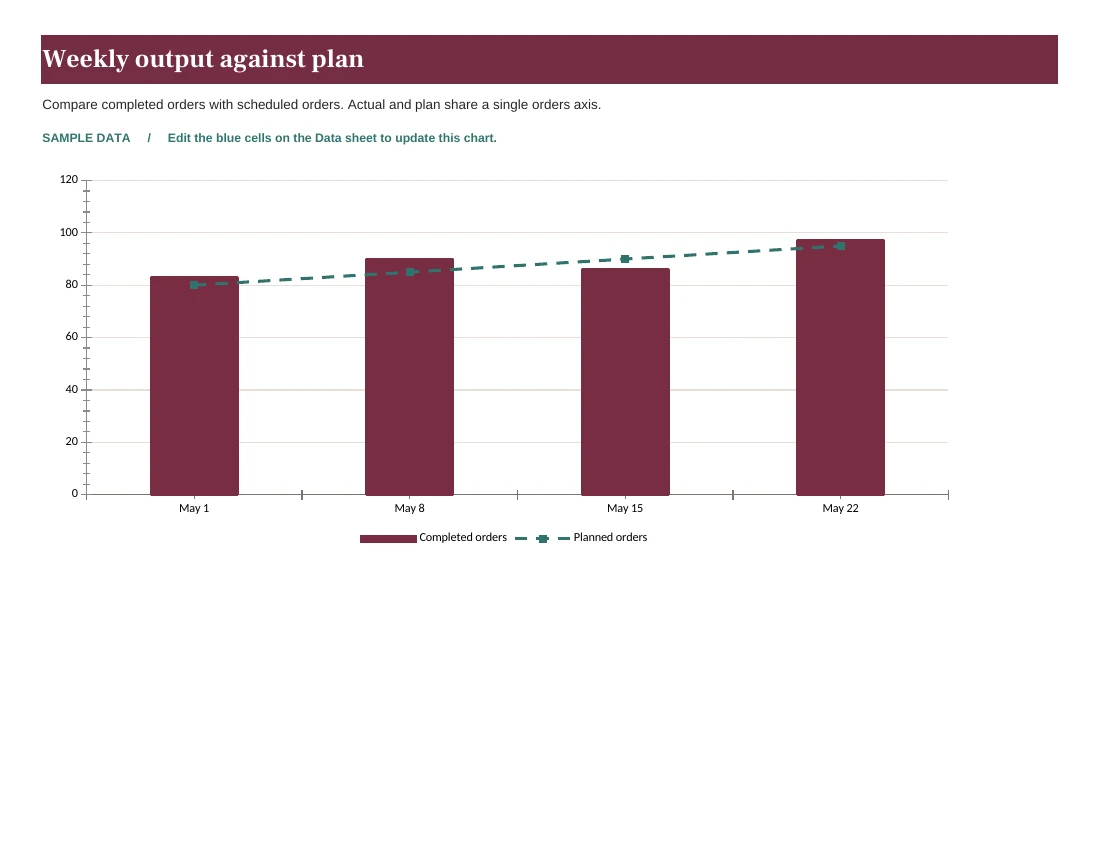
Weekly output against plan
Compare completed orders with scheduled orders. Actual and plan share a single orders axis.
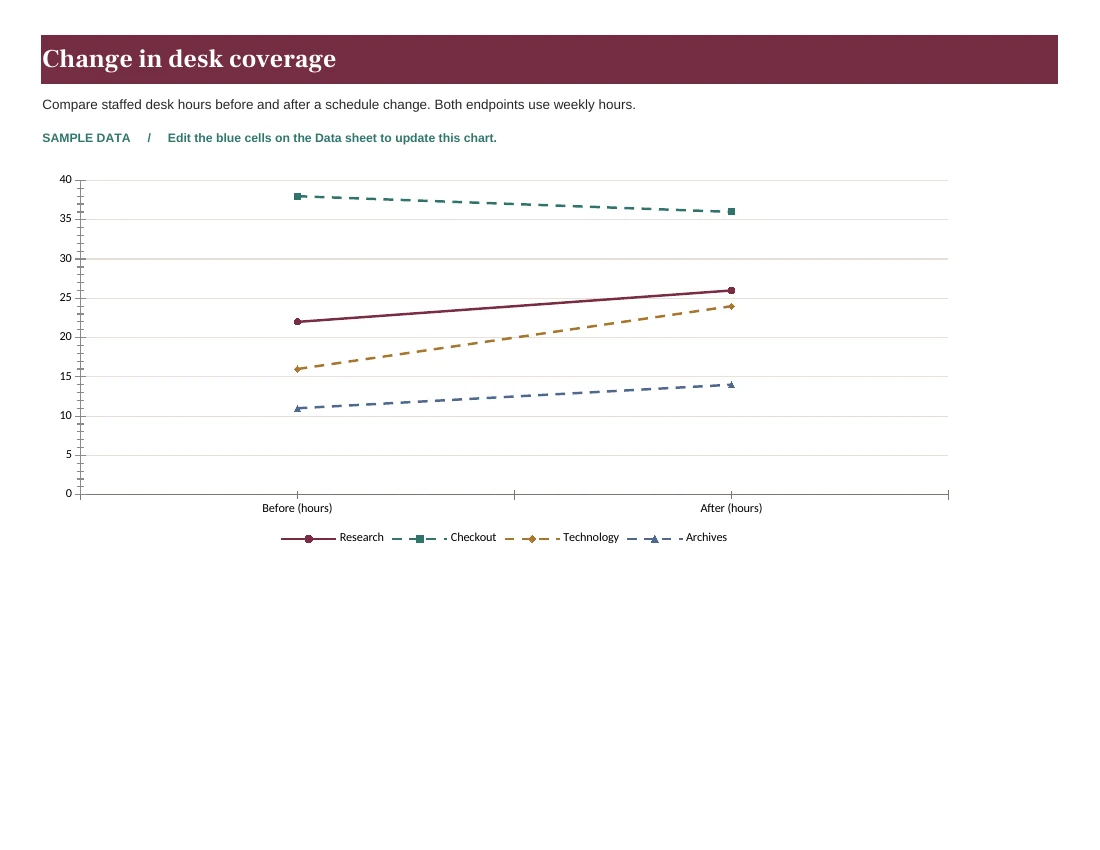
Change in desk coverage
Compare staffed desk hours before and after a schedule change. Both endpoints use weekly hours.
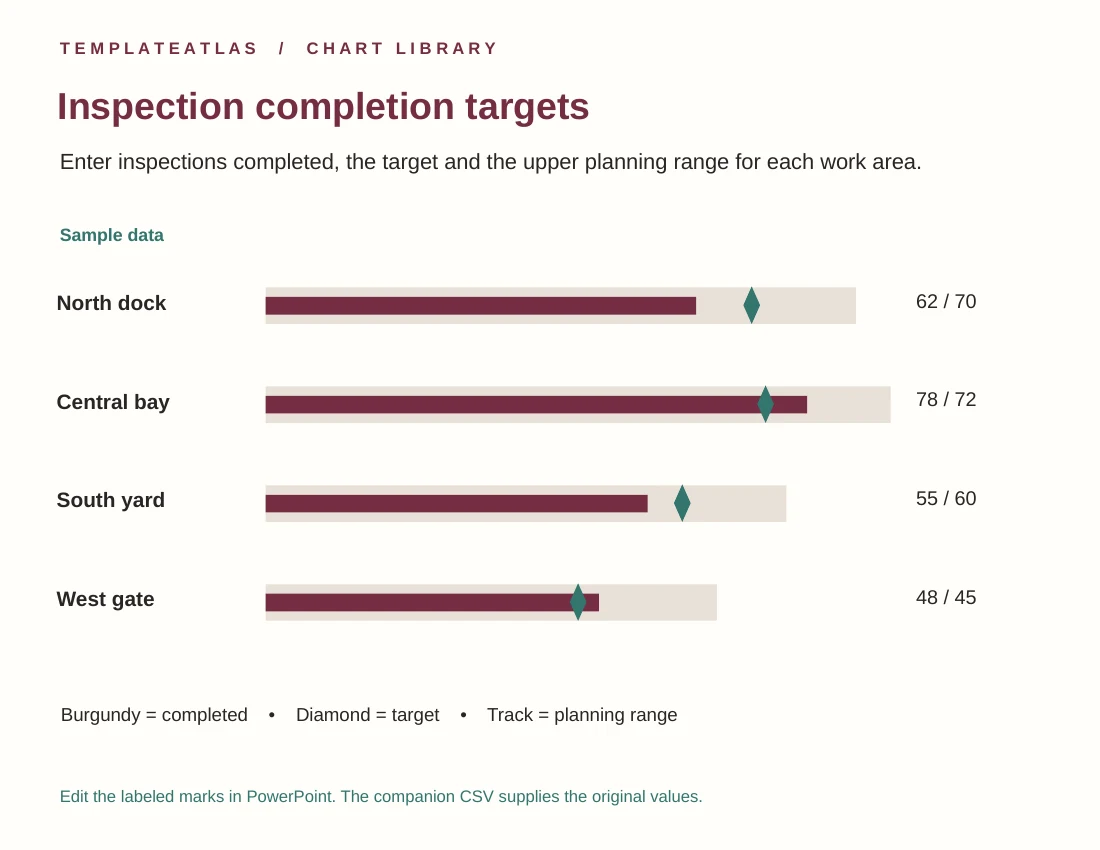
Inspection completion targets
Enter inspections completed, the target and the upper planning range for each work area.
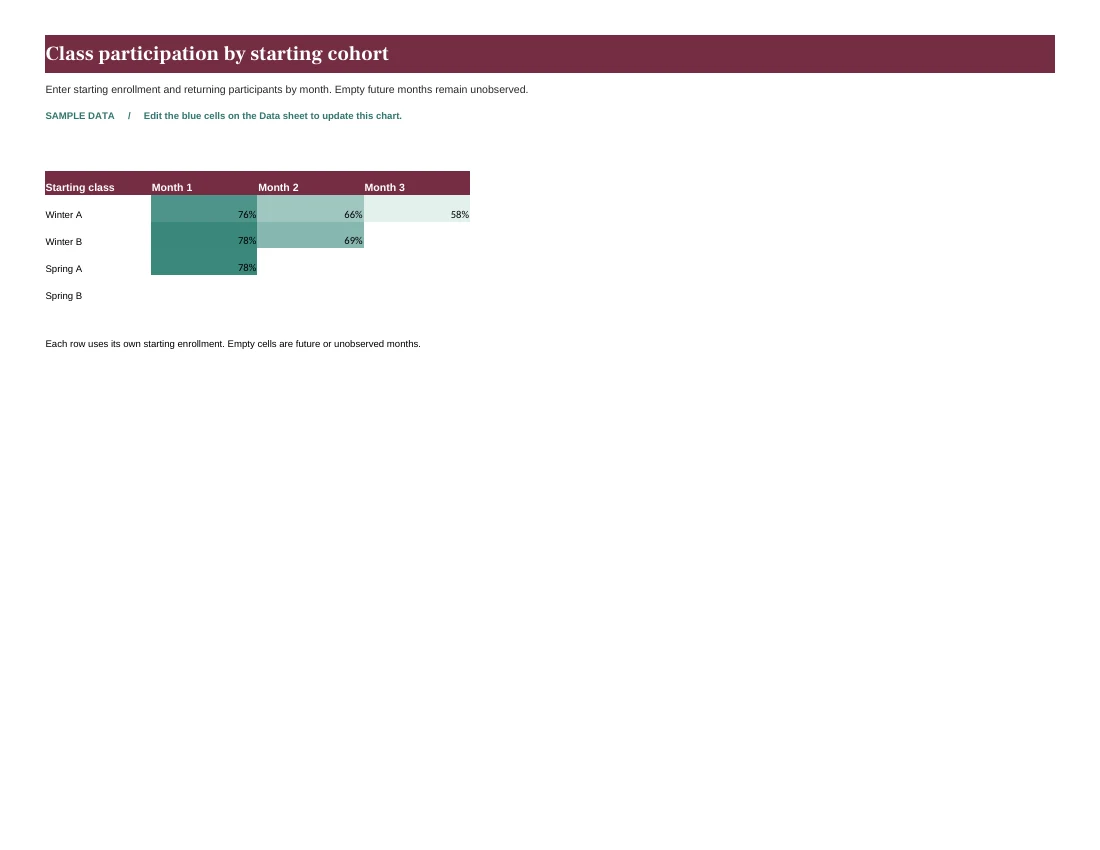
Class participation by starting cohort
Enter starting enrollment and returning participants by month. Empty future months remain unobserved.
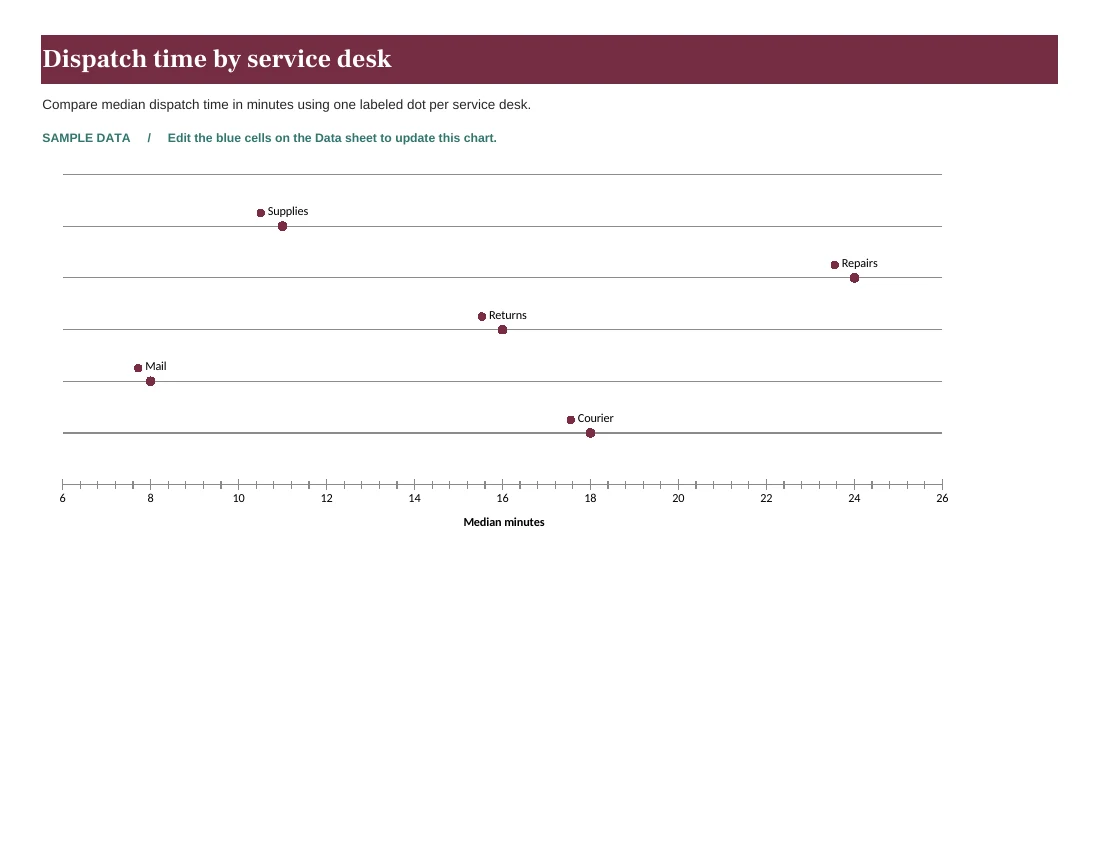
Dispatch time by service desk
Compare median dispatch time in minutes using one labeled dot per service desk.
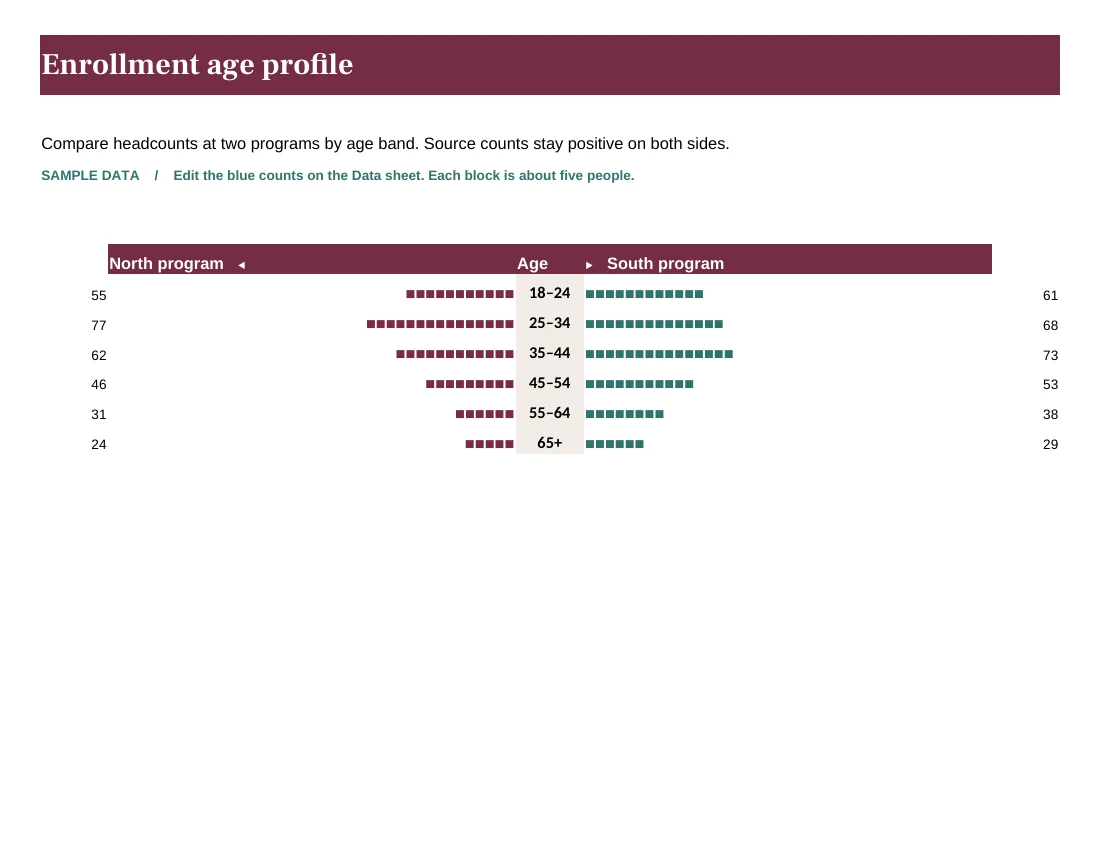
Enrollment age profile
Compare headcounts at two programs by age band. Source counts stay positive on both sides.
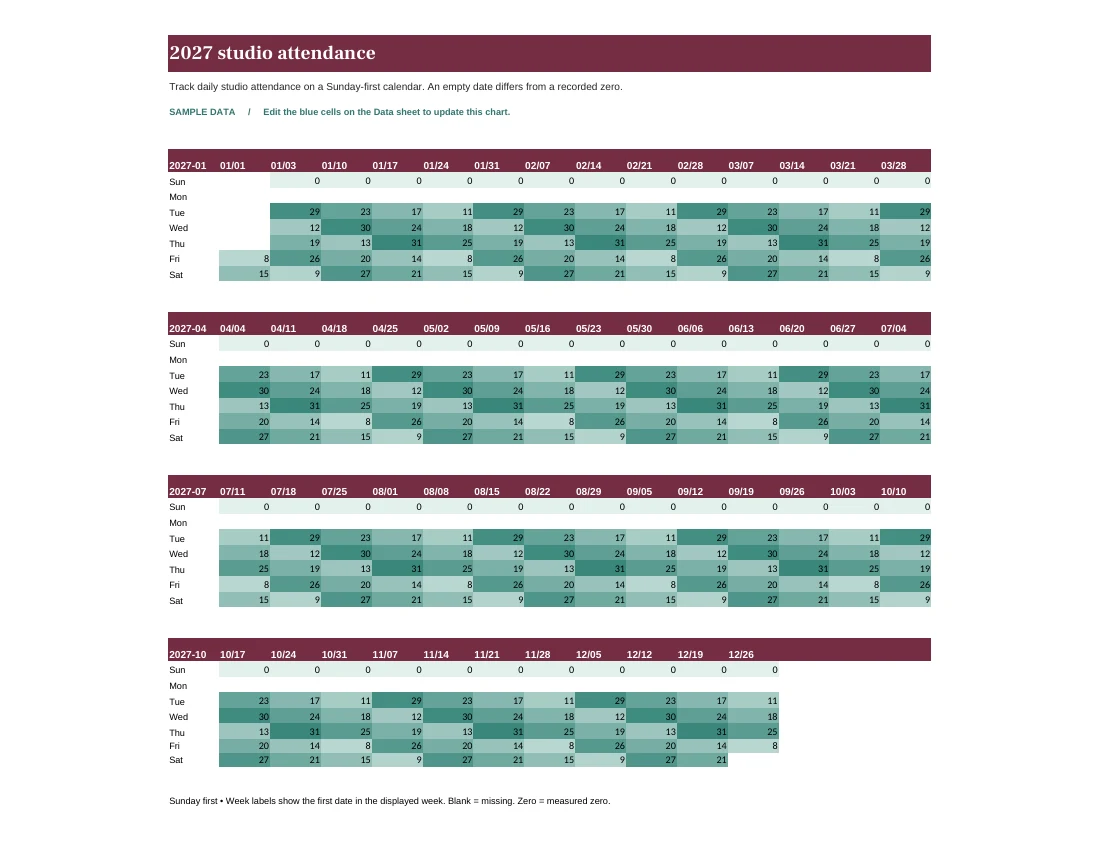
2027 studio attendance
Track daily studio attendance on a Sunday-first calendar. An empty date differs from a recorded zero.