 TemplateAtlas
The TemplateAtlas catalog
Charts & Graphs
Explore data visualizations, process diagrams, and reference charts. Build a chart from your own numbers in Chart Studio.
Open Chart Studio →Choose a chart to build
Bar graphPie chartLine chartArea chartStacked bar chartScatter plotBubble chartHistogramBox-and-whisker plotHeatmapPareto chartRadar chartCombo chartFunnel chartSlope chartBullet chartCash-flow chartDot plotPopulation pyramid2027 calendar heatmapBurndown chartCohort retention chartTreemap chartSunburst chartSankey diagramWaterfall chartX-bar and R control chart
Printable Reference Charts44 templatesData Visualization18 templatesBusiness & Finance Charts22 templatesProject & Process Charts31 templatesEducation & STEM Charts16 templates
In this collection
3 templates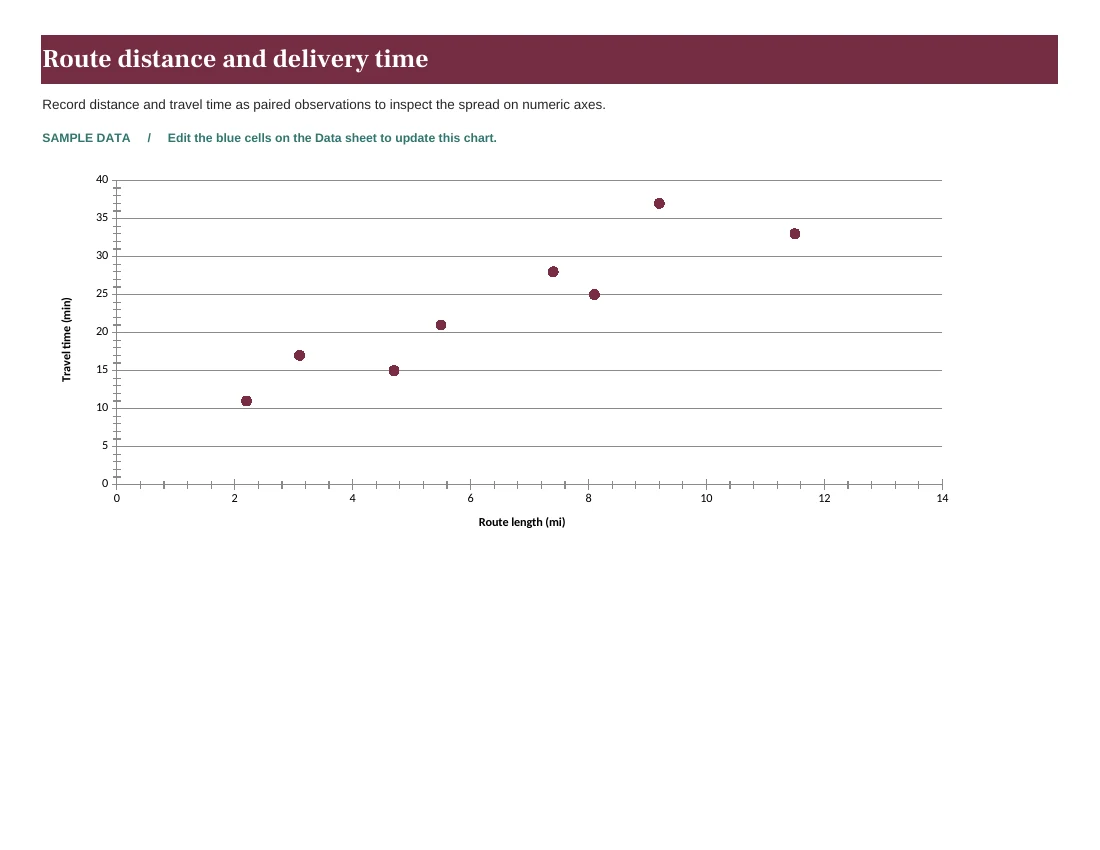
xlsx · pdf · svg · csv · jpg
Route distance and delivery time
Record distance and travel time as paired observations to inspect the spread on numeric axes.
xlsx · pdf · svg · csv · jpg
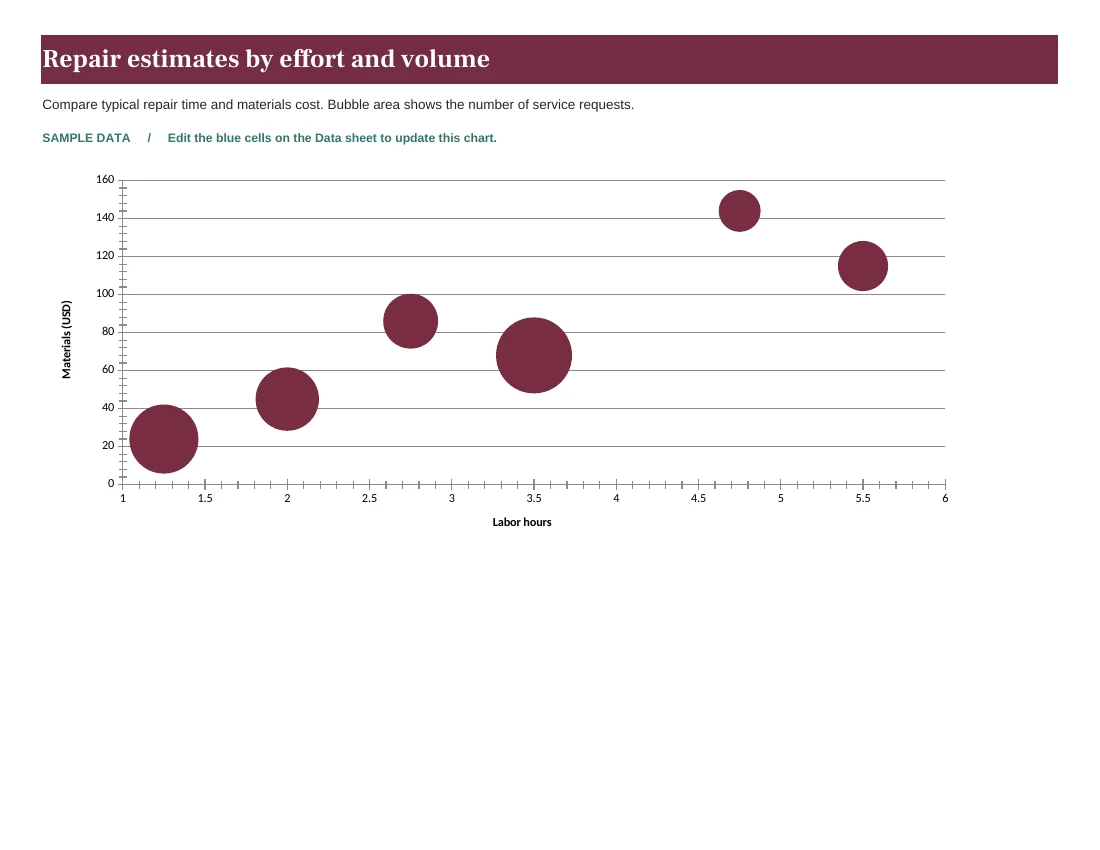
Repair estimates by effort and volume
Compare typical repair time and materials cost. Bubble area shows the number of service requests.
xlsx · pdf · svg · csv · jpg
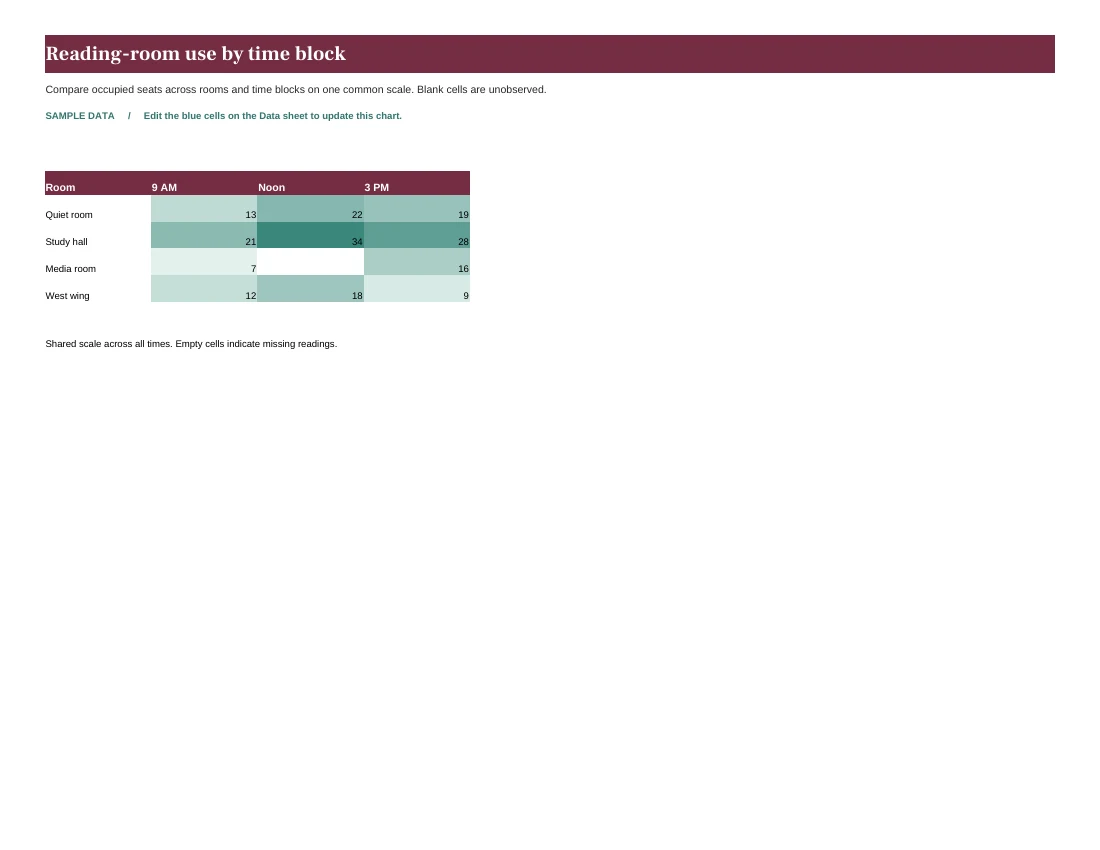
Reading-room use by time block
Compare occupied seats across rooms and time blocks on one common scale. Blank cells are unobserved.