 TemplateAtlas
The TemplateAtlas catalog
Charts & Graphs
Explore data visualizations, process diagrams, and reference charts. Build a chart from your own numbers in Chart Studio.
Open Chart Studio →Choose a chart to build
In this collection
131 templates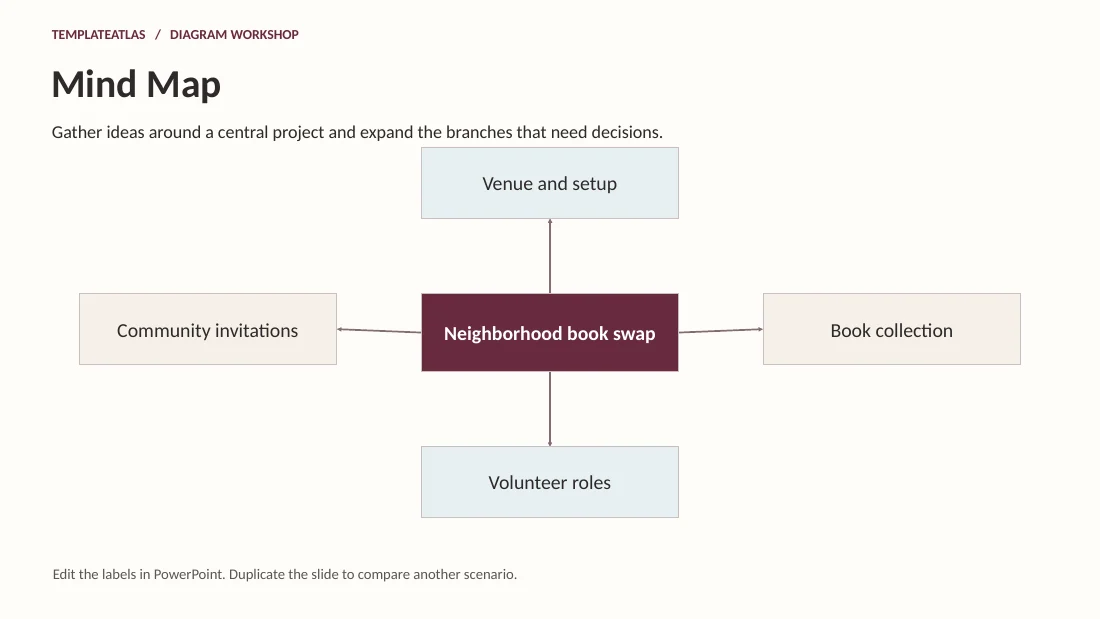
Mind Map
Gather ideas around a central project and expand the branches that need decisions.
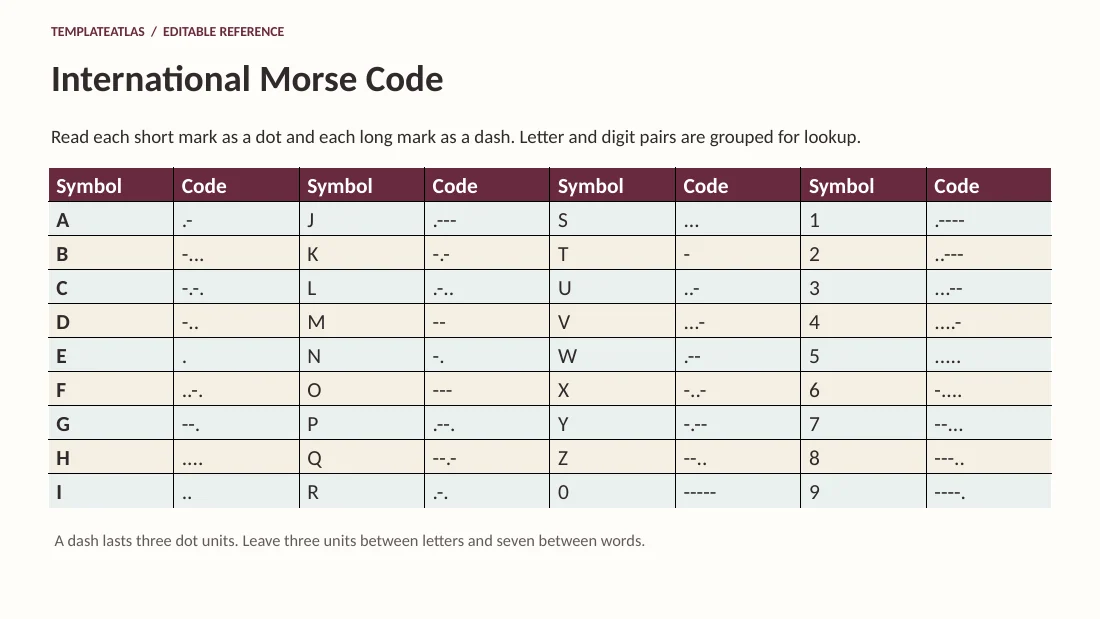
International Morse Code
Read each short mark as a dot and each long mark as a dash. Letter and digit pairs are grouped for lookup.
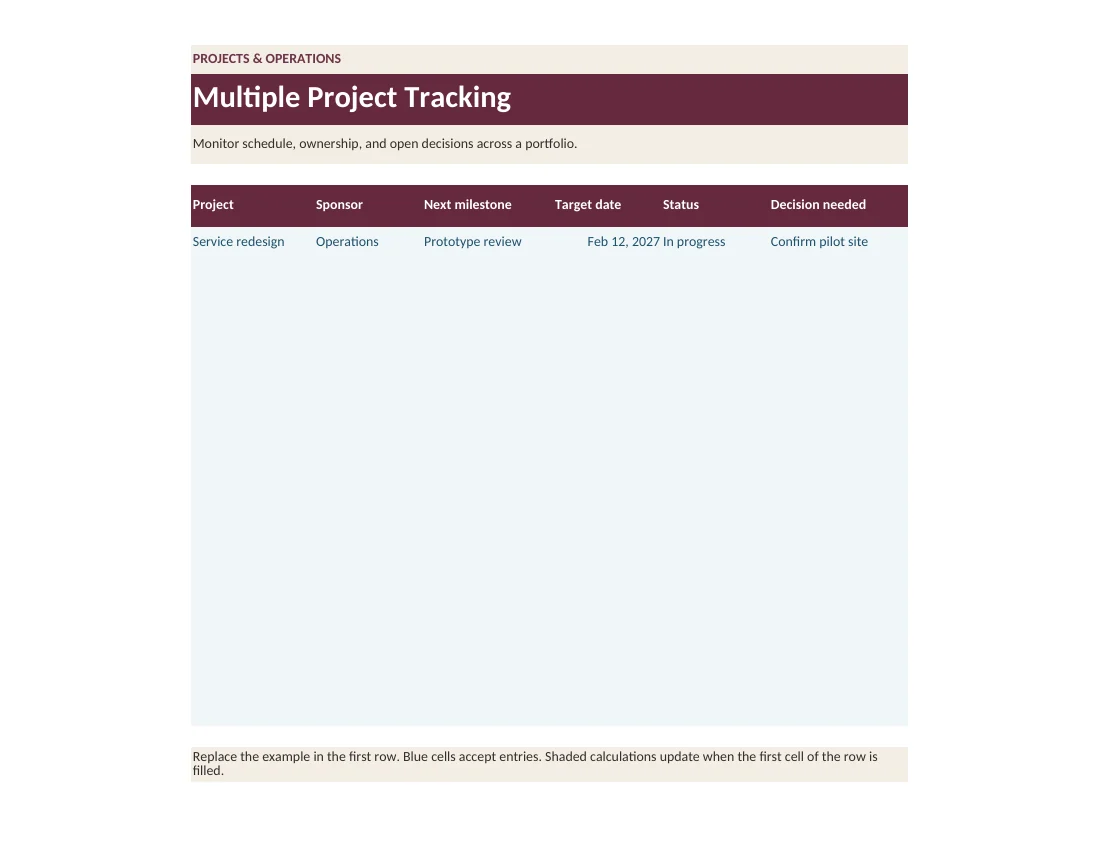
Multiple Project Tracking
Monitor schedule, ownership, and open decisions across a portfolio.
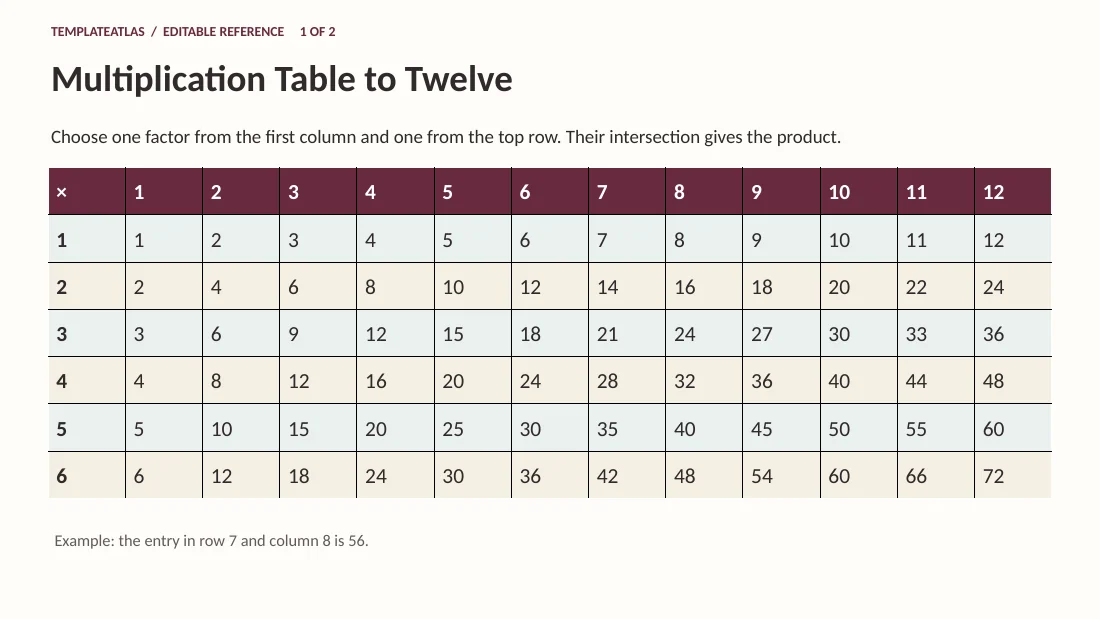
Multiplication Table to Twelve
Choose one factor from the first column and one from the top row. Their intersection gives the product.
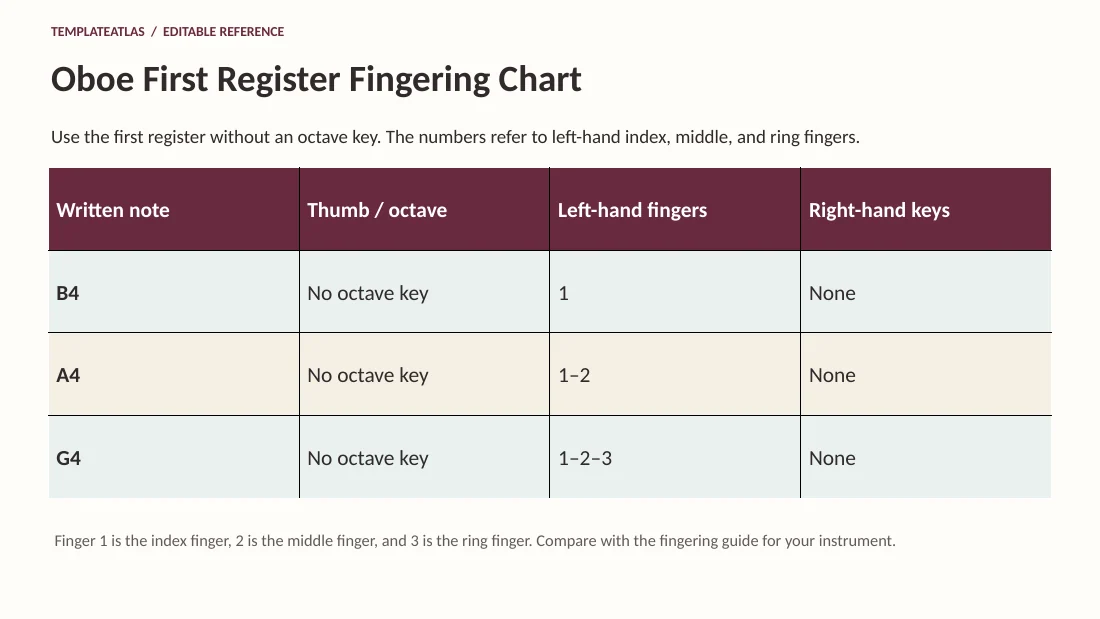
Oboe First Register Fingering Chart
Use the first register without an octave key. The numbers refer to left-hand index, middle, and ring fingers.
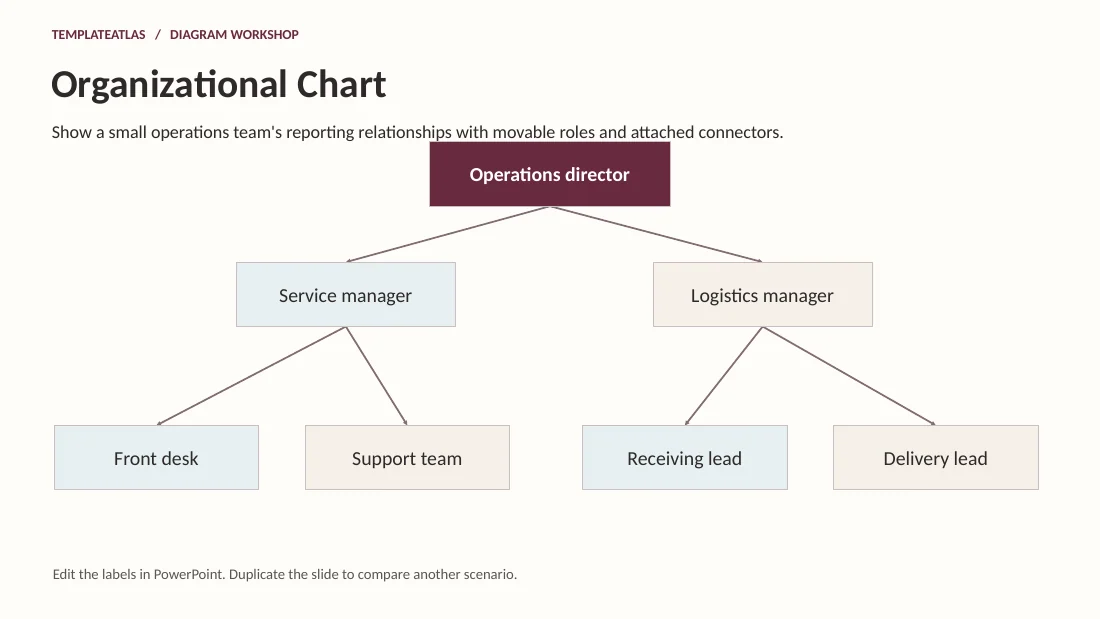
Organizational Chart
Show a small operations team's reporting relationships with movable roles and attached connectors.
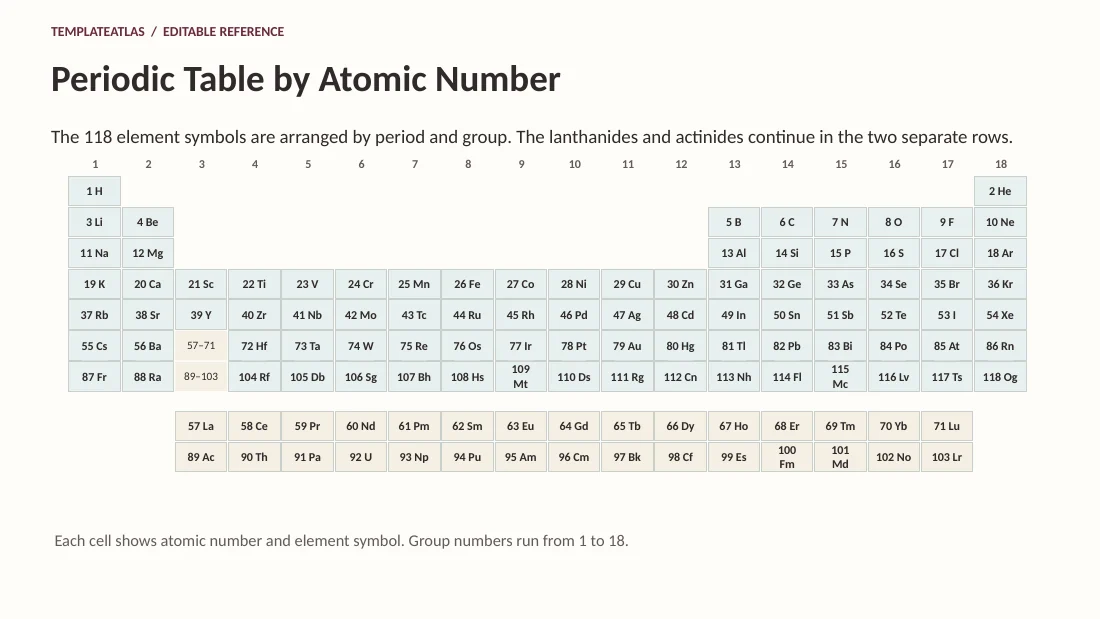
Periodic Table by Atomic Number
The 118 element symbols are arranged by period and group. The lanthanides and actinides continue in the two separate rows.
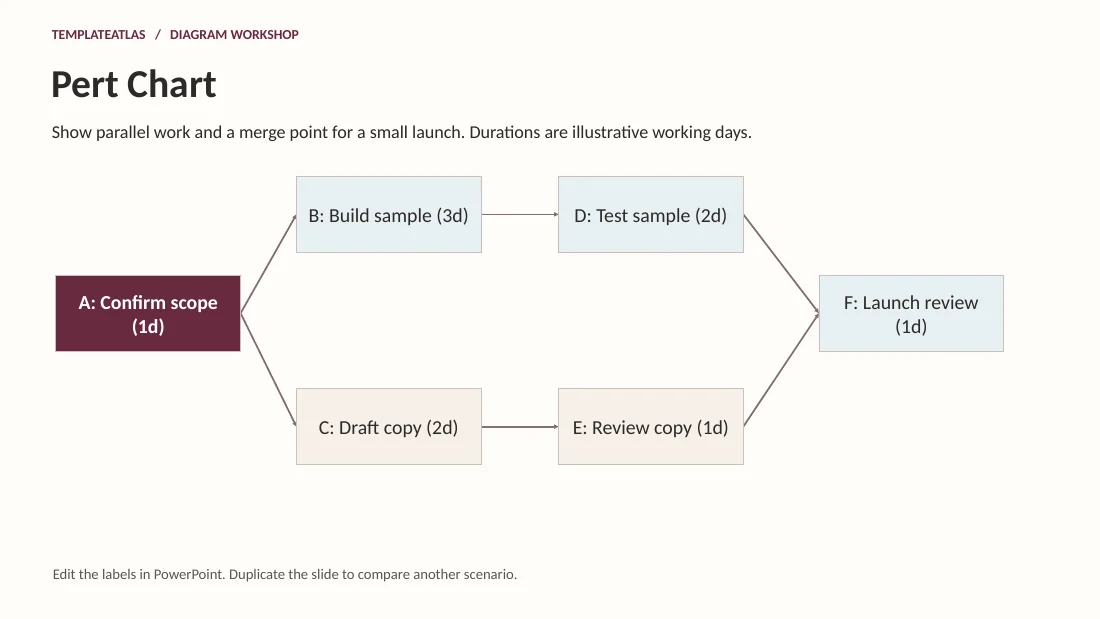
Pert Chart
Show parallel work and a merge point for a small launch. Durations are illustrative working days.
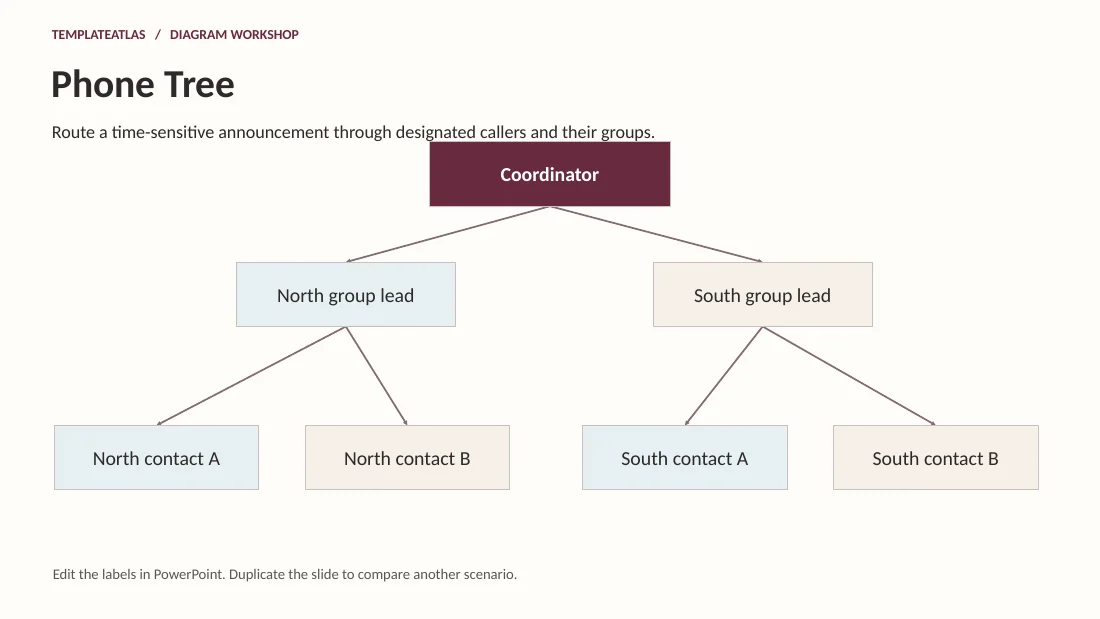
Phone Tree
Route a time-sensitive announcement through designated callers and their groups.
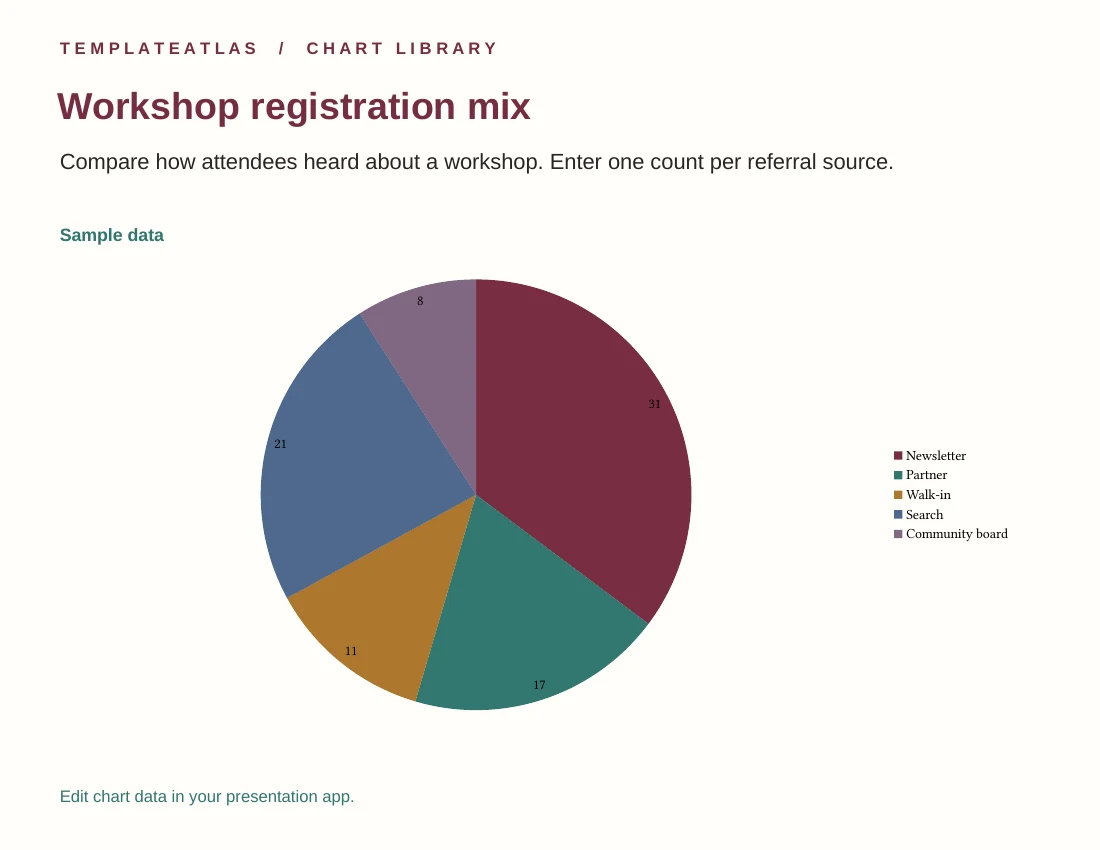
Workshop registration mix
Compare how attendees heard about a workshop. Enter one count per referral source.
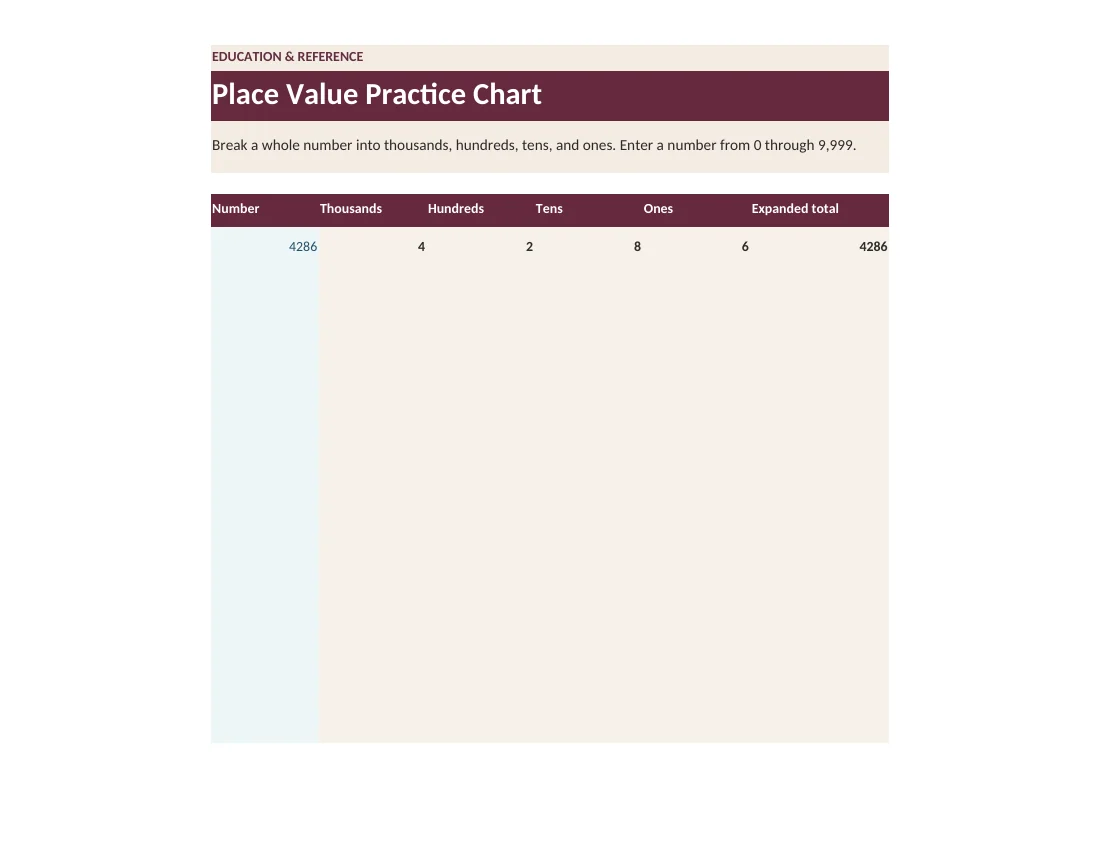
Place Value Practice Chart
Break a whole number into thousands, hundreds, tens, and ones. Enter a number from 0 through 9,999.
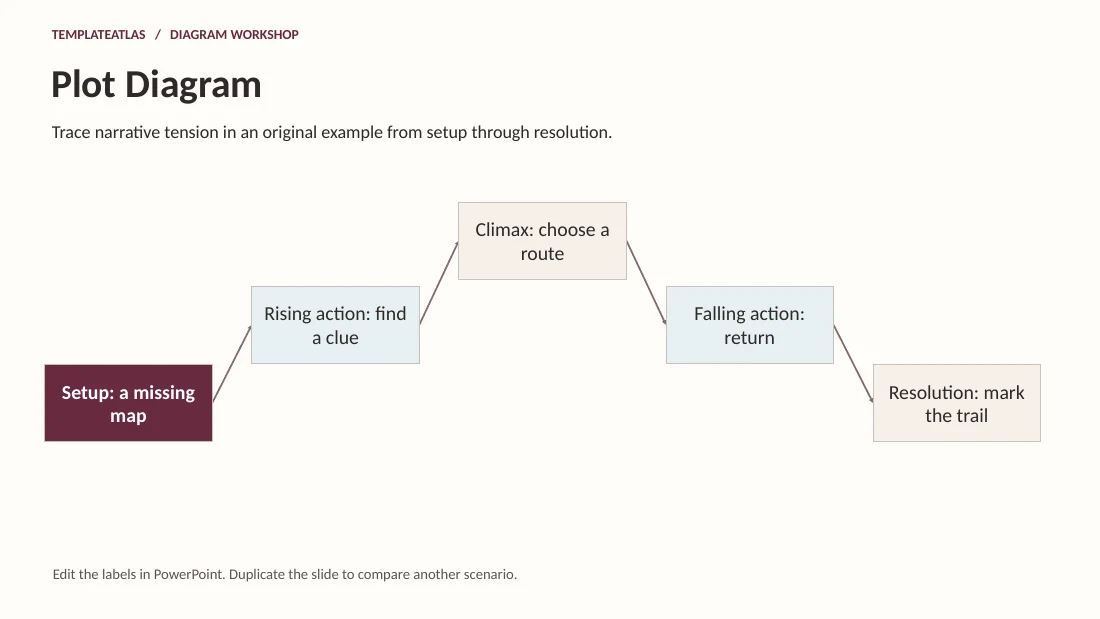
Plot Diagram
Trace narrative tension in an original example from setup through resolution.
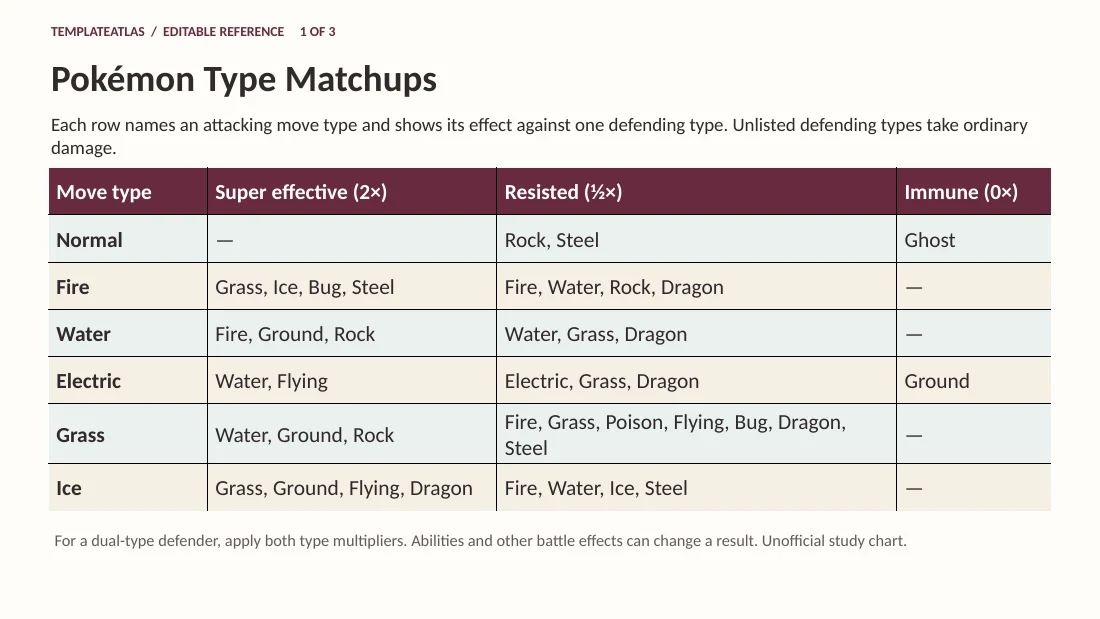
Pokémon Type Matchups
Each row names an attacking move type and shows its effect against one defending type. Unlisted defending types take ordinary damage.
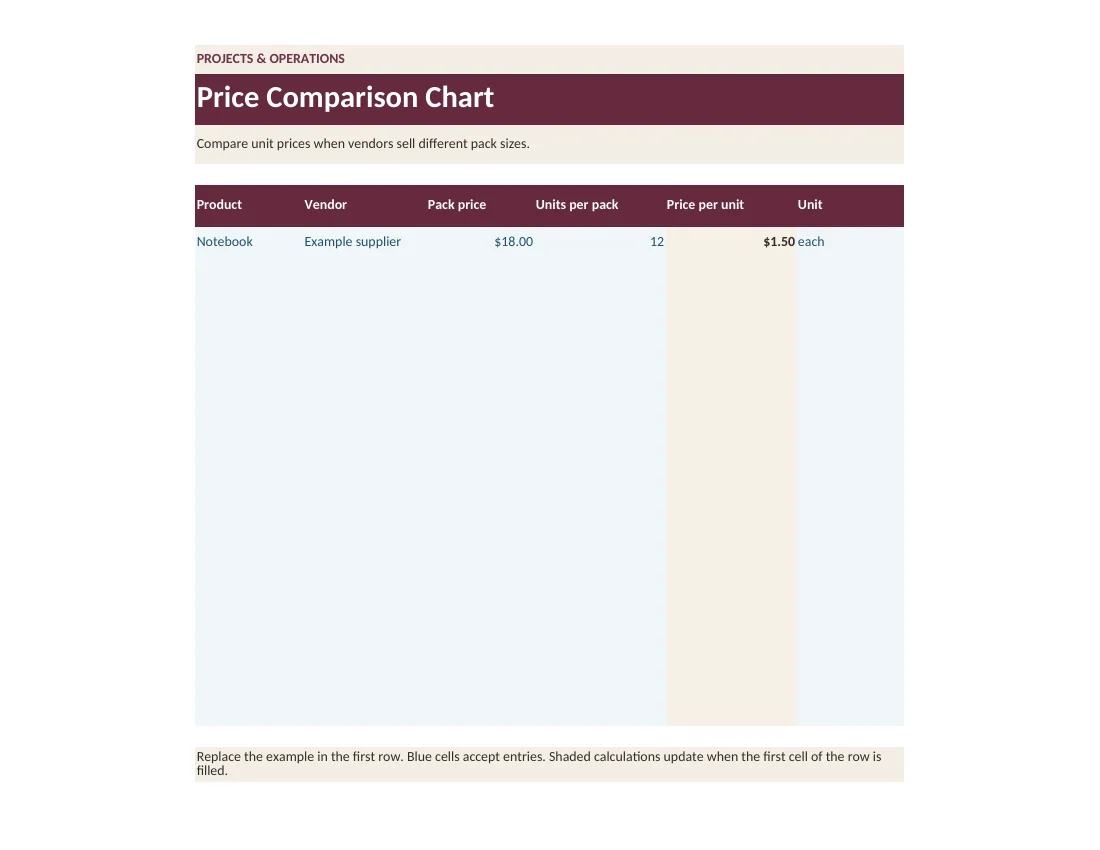
Price Comparison Chart
Compare unit prices when vendors sell different pack sizes.
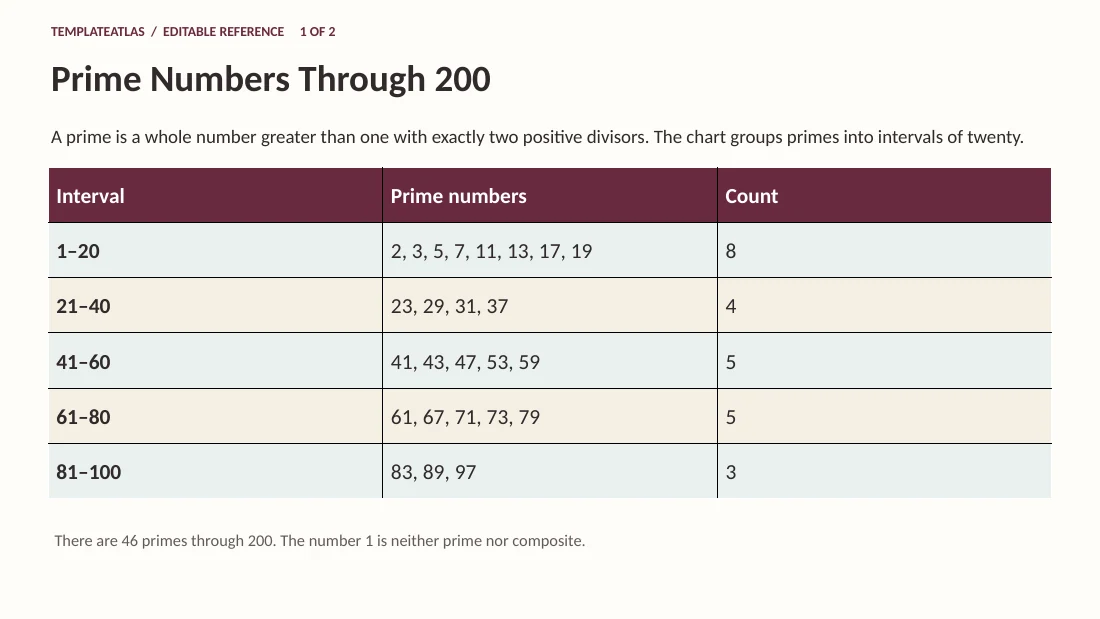
Prime Numbers Through 200
A prime is a whole number greater than one with exactly two positive divisors. The chart groups primes into intervals of twenty.
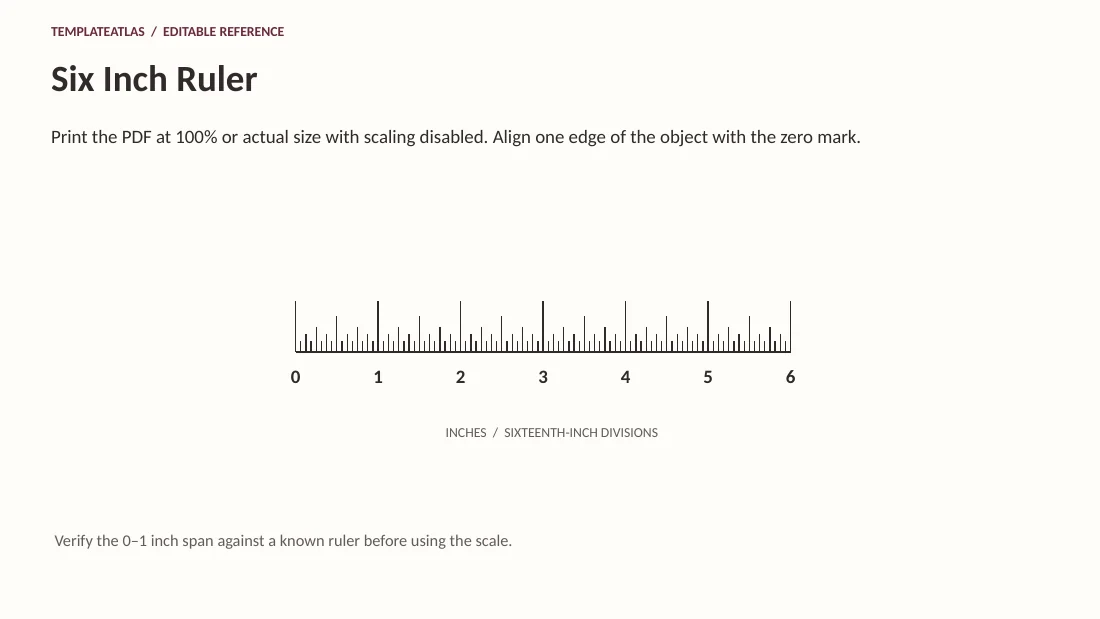
Six Inch Ruler
Print the PDF at 100% or actual size with scaling disabled. Align one edge of the object with the zero mark.
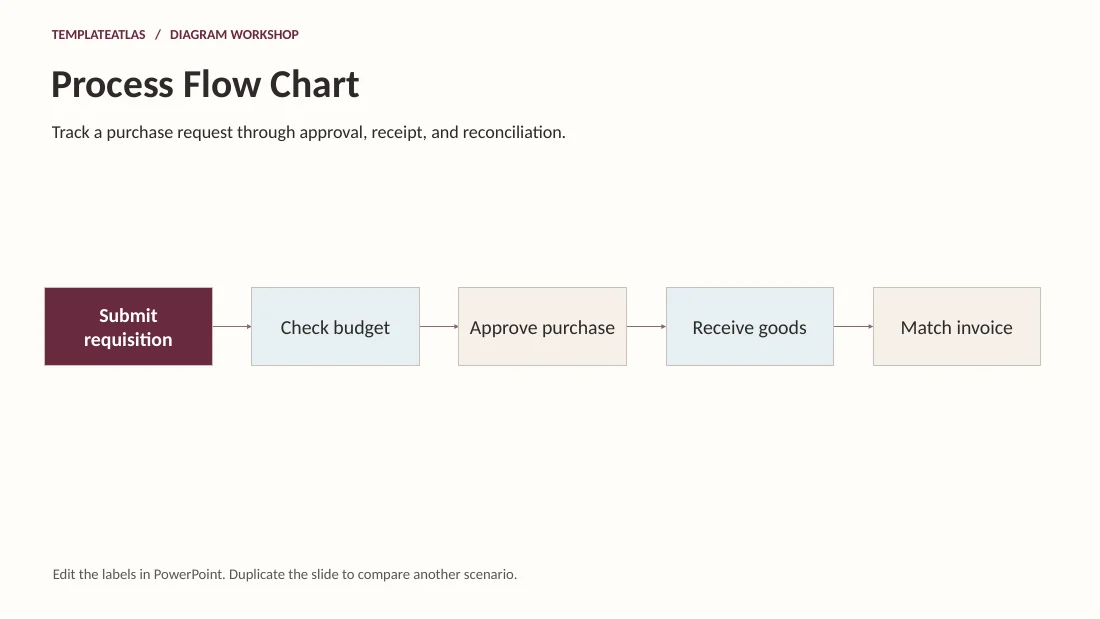
Process Flow Chart
Track a purchase request through approval, receipt, and reconciliation.
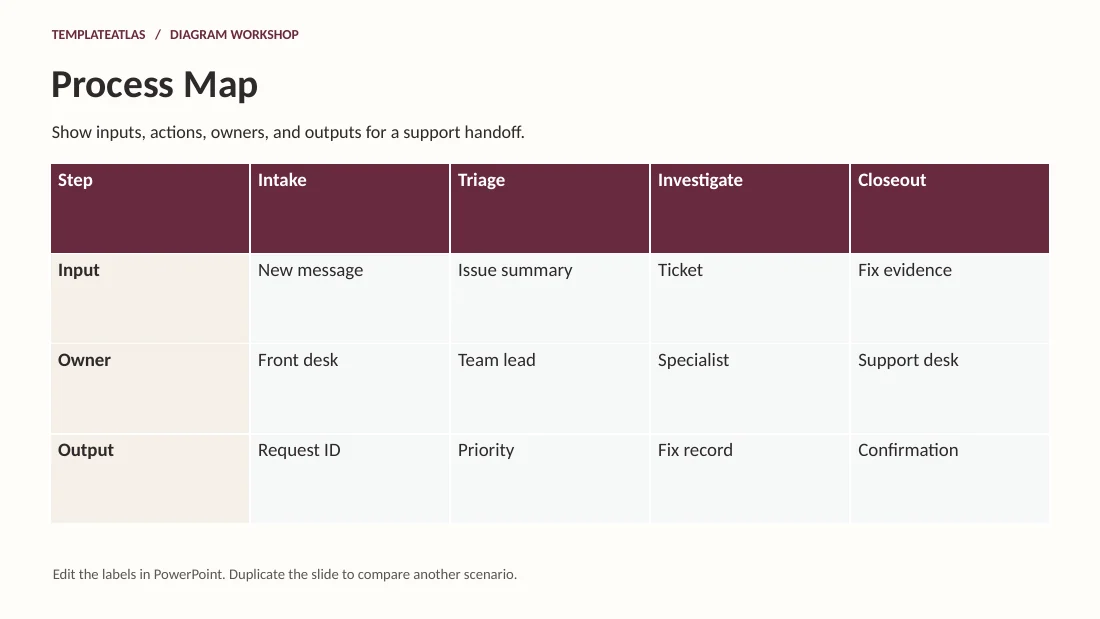
Process Map
Show inputs, actions, owners, and outputs for a support handoff.
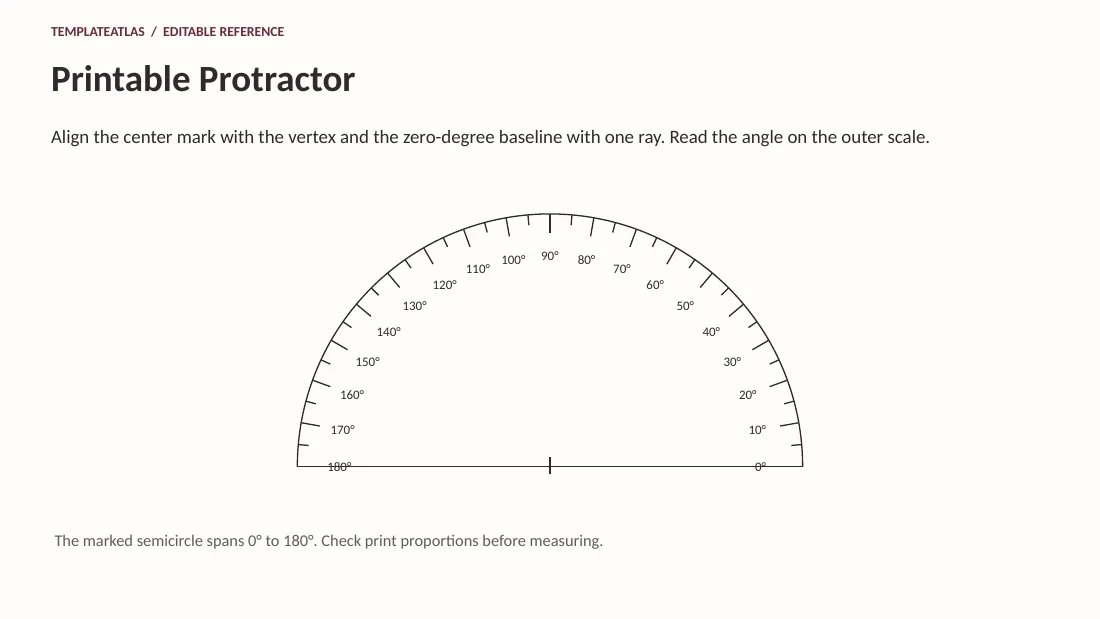
Printable Protractor
Align the center mark with the vertex and the zero-degree baseline with one ray. Read the angle on the outer scale.
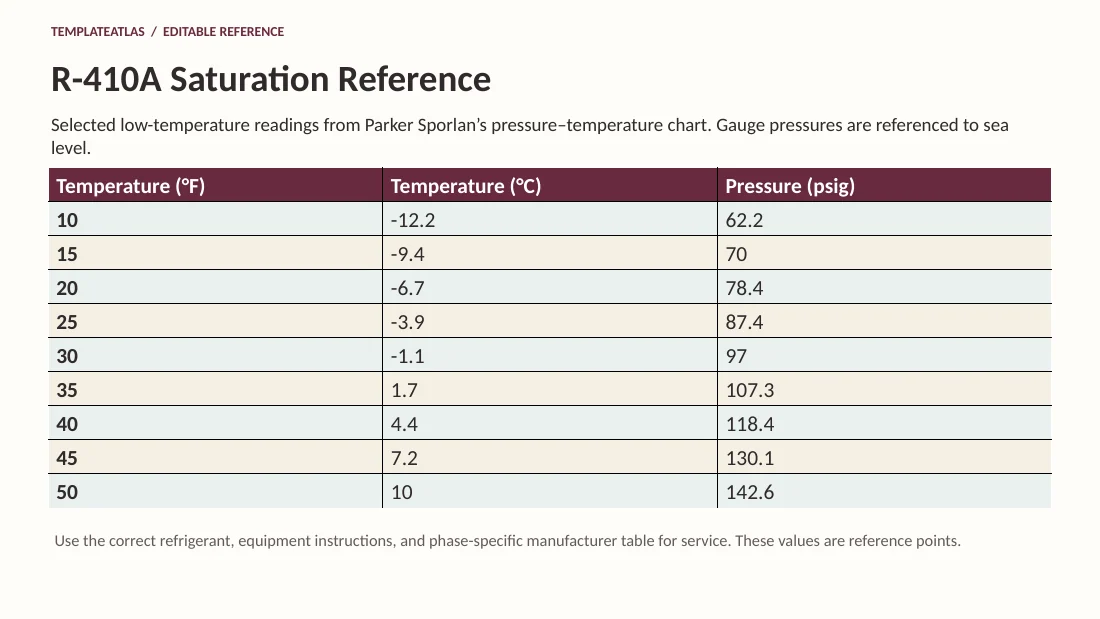
R-410A Saturation Reference
Selected low-temperature readings from Parker Sporlan’s pressure–temperature chart. Gauge pressures are referenced to sea level.
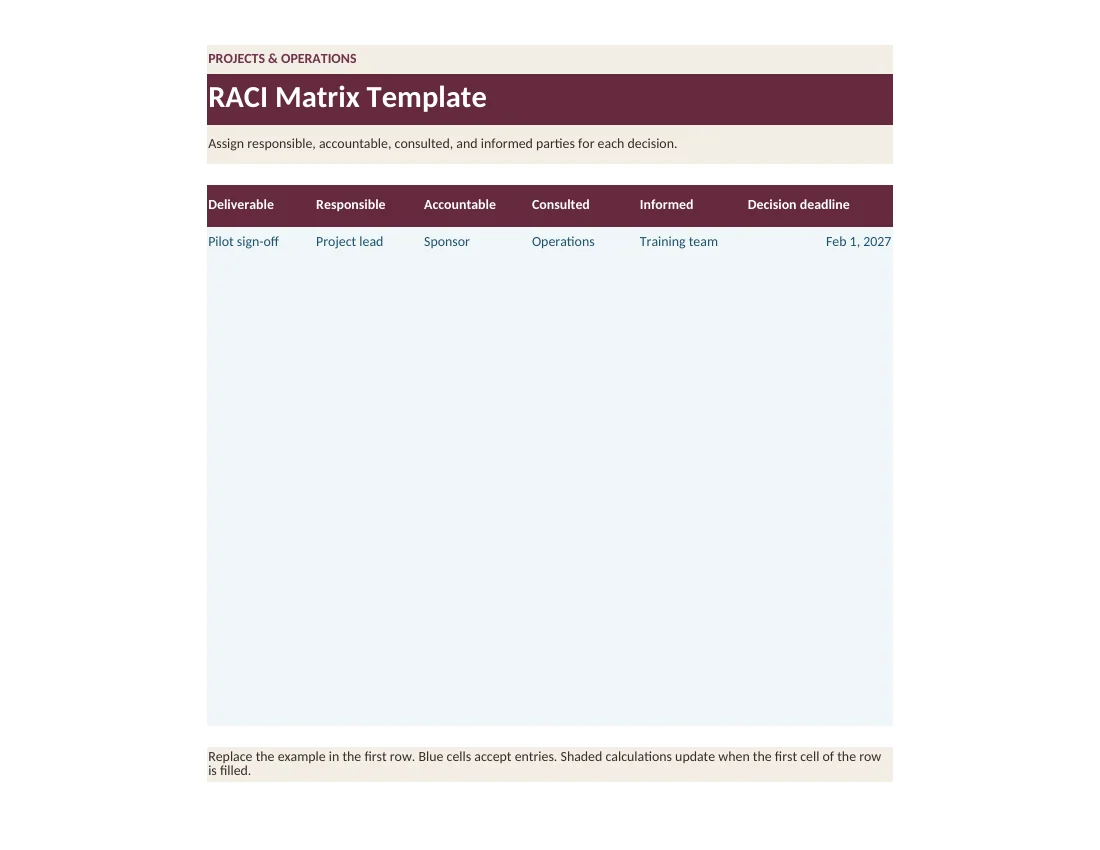
RACI Matrix Template
Assign responsible, accountable, consulted, and informed parties for each decision.
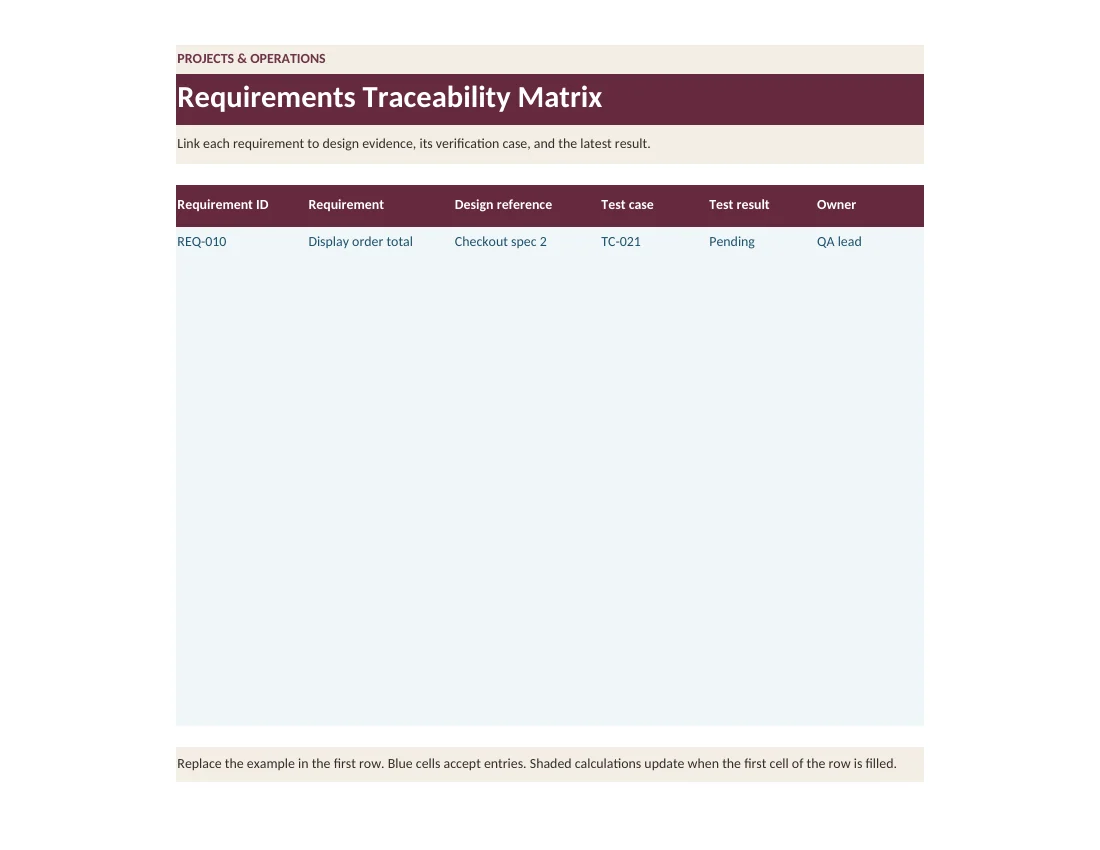
Requirements Traceability Matrix
Link each requirement to design evidence, its verification case, and the latest result.
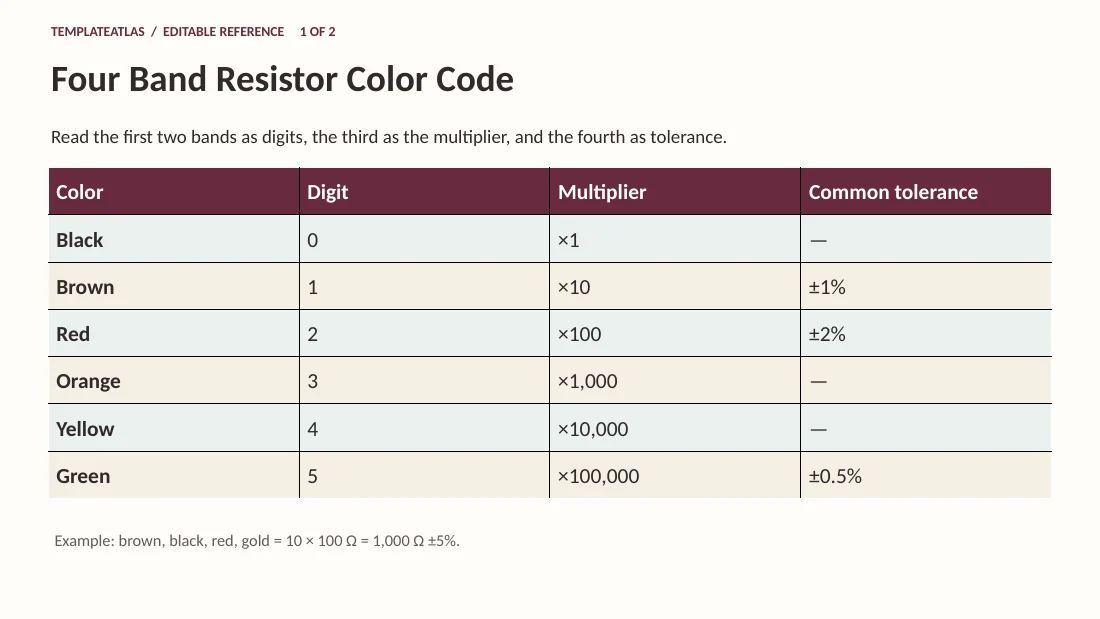
Four Band Resistor Color Code
Read the first two bands as digits, the third as the multiplier, and the fourth as tolerance.
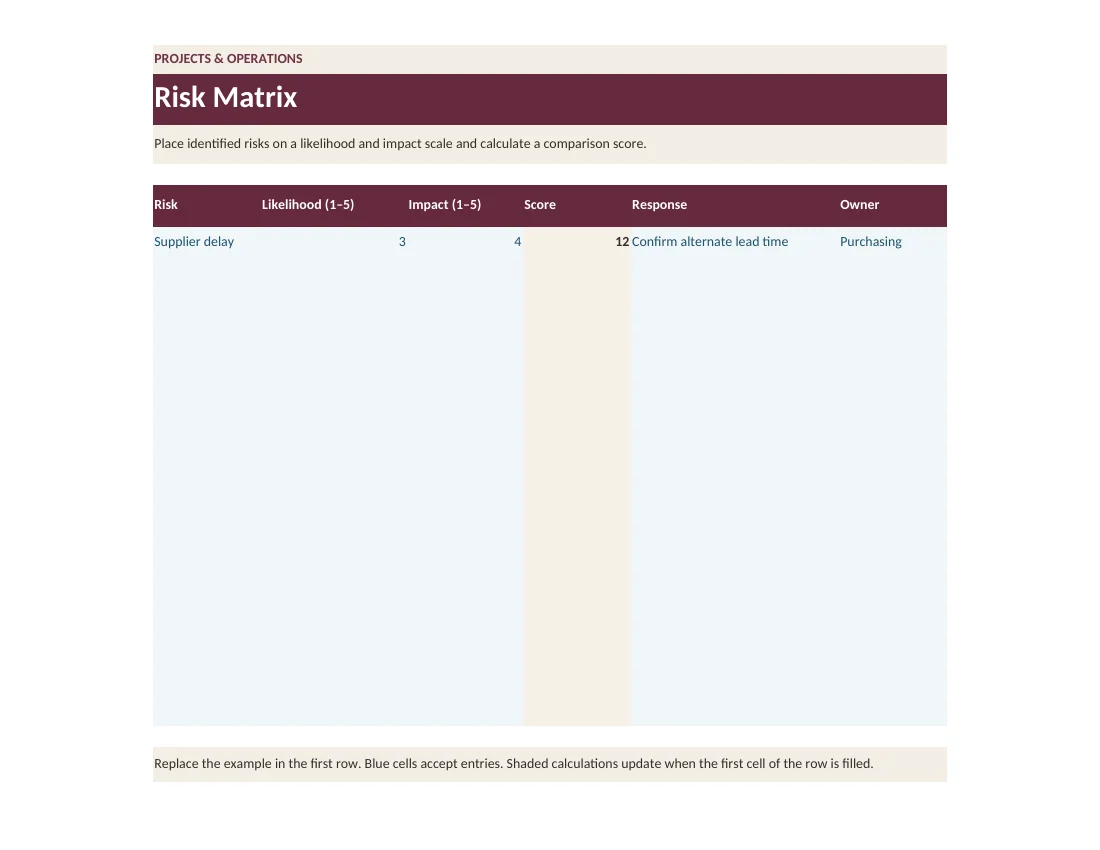
Risk Matrix
Place identified risks on a likelihood and impact scale and calculate a comparison score.