 TemplateAtlas
The TemplateAtlas catalog
Charts & Graphs
Explore data visualizations, process diagrams, and reference charts. Build a chart from your own numbers in Chart Studio.
Open Chart Studio →Choose a chart to build
In this collection
131 templates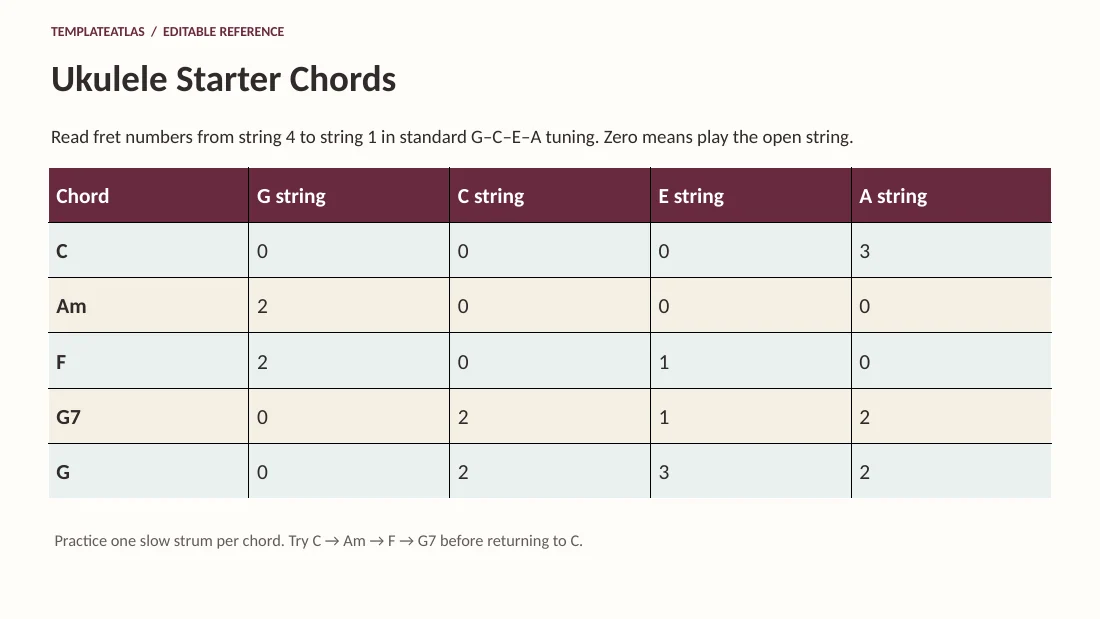
Ukulele Starter Chords
Read fret numbers from string 4 to string 1 in standard G–C–E–A tuning. Zero means play the open string.
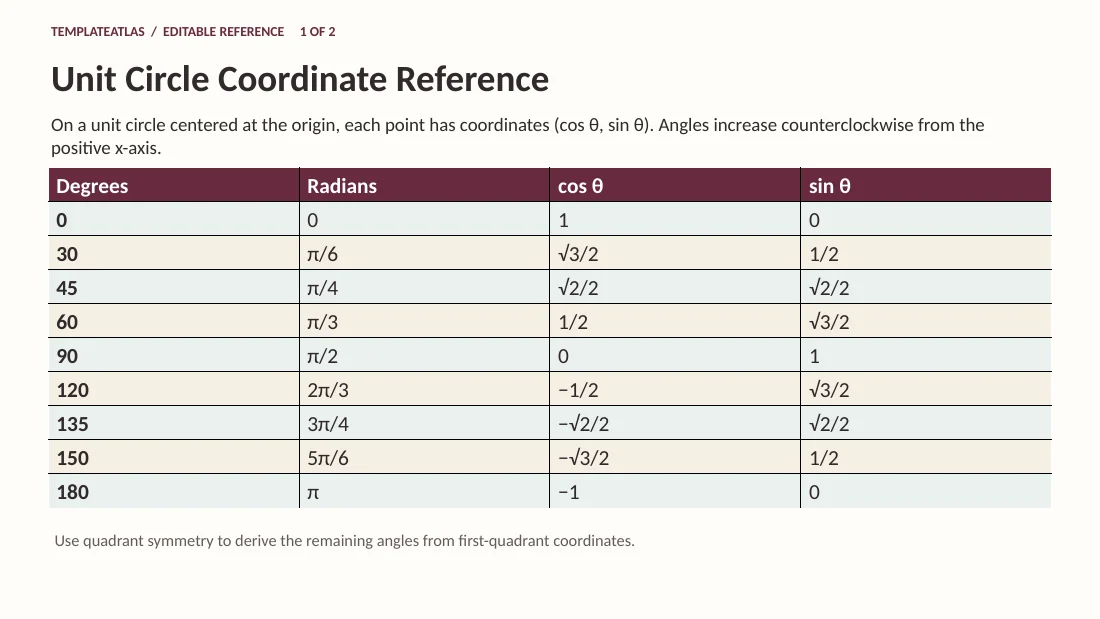
Unit Circle Coordinate Reference
On a unit circle centered at the origin, each point has coordinates (cos θ, sin θ). Angles increase counterclockwise from the positive x-axis.
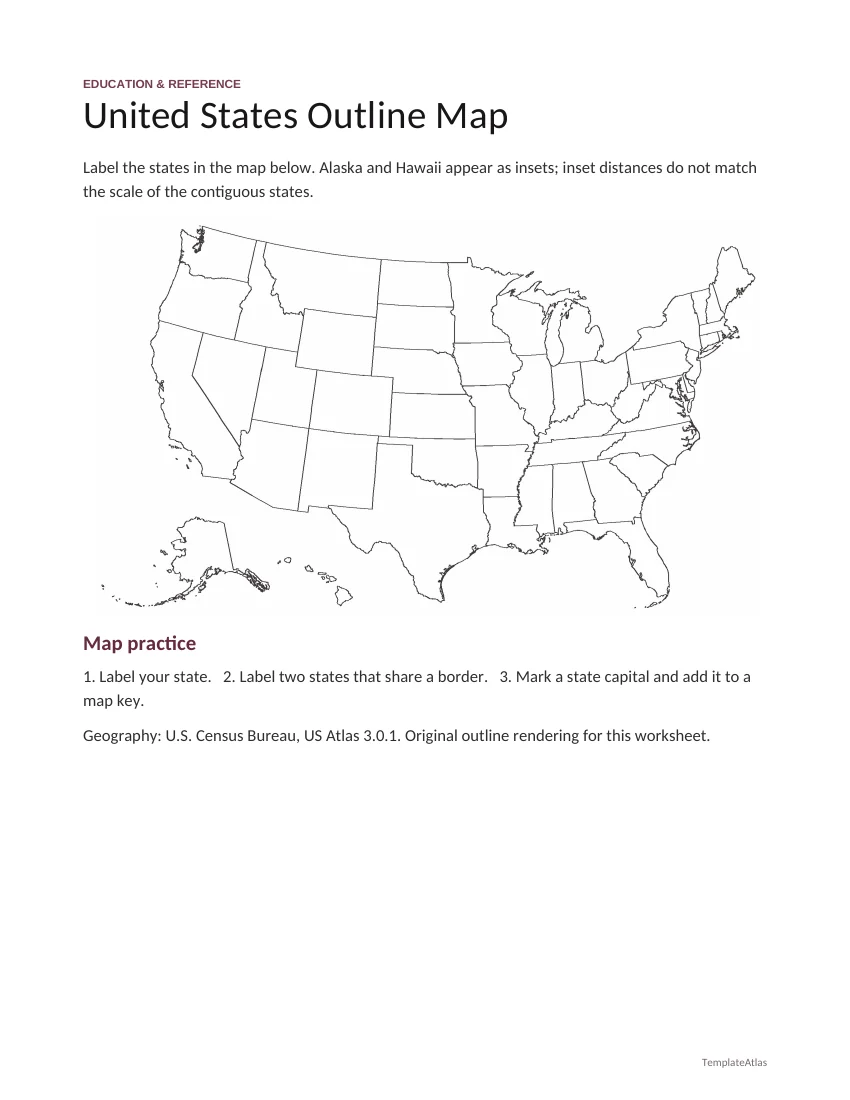
United States Outline Map
Label the states in the map below. Alaska and Hawaii appear as insets; inset distances do not match the scale of the contiguous states.
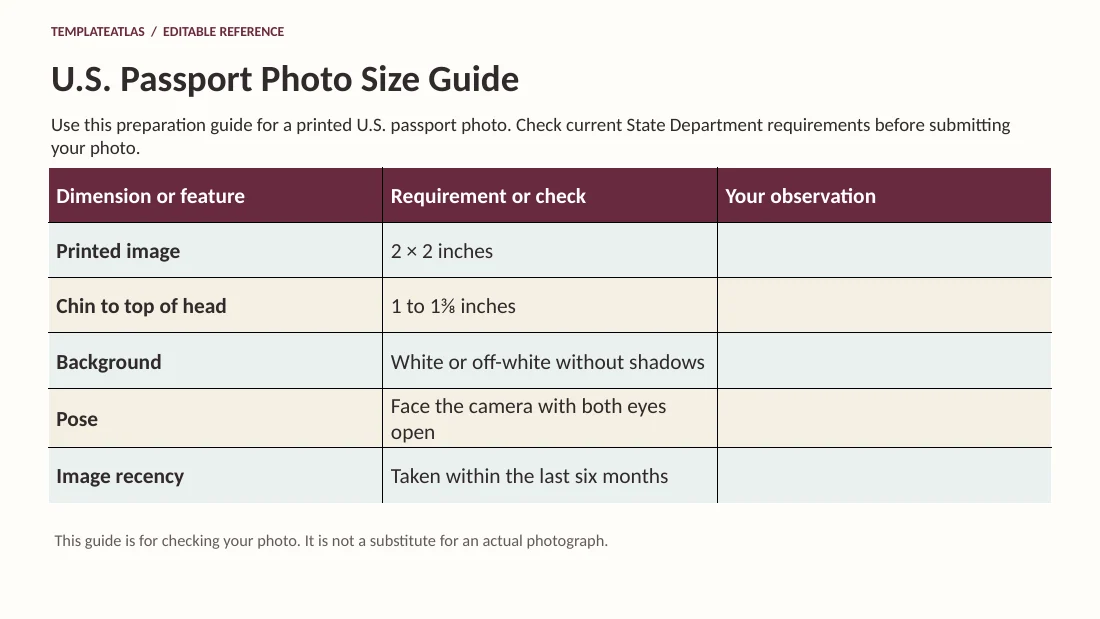
U.S. Passport Photo Size Guide
Use this preparation guide for a printed U.S. passport photo. Check current State Department requirements before submitting your photo.
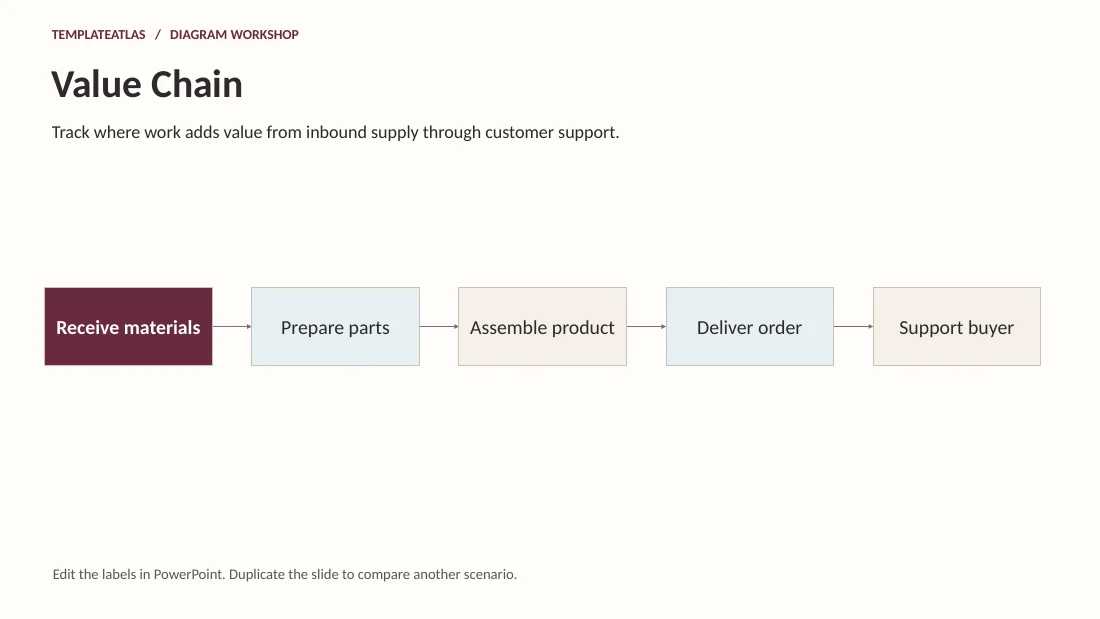
Value Chain
Track where work adds value from inbound supply through customer support.
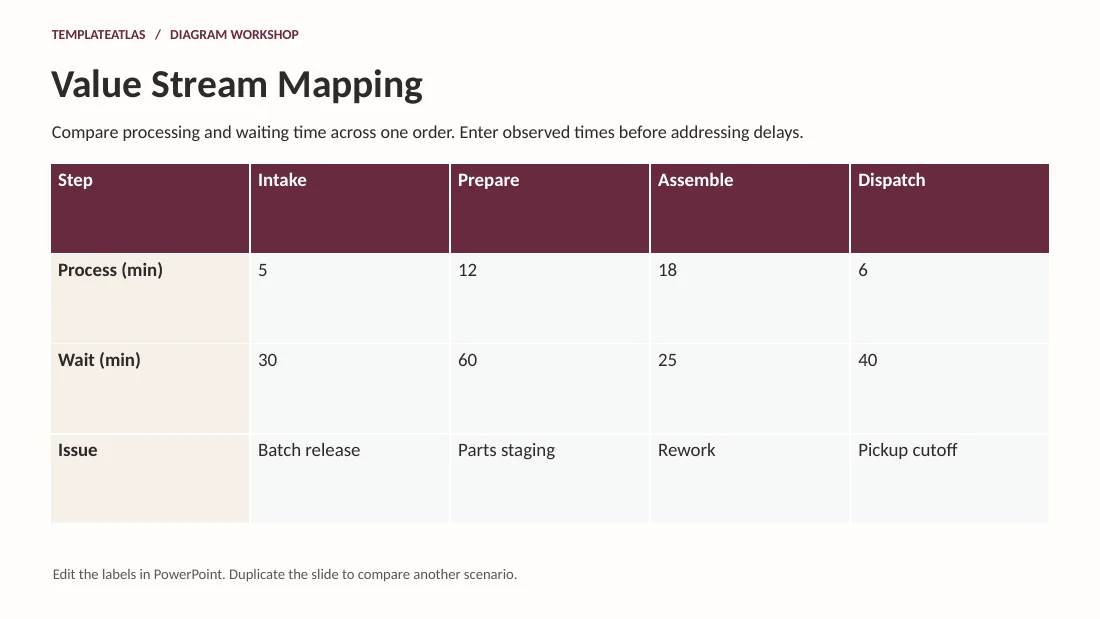
Value Stream Mapping
Compare processing and waiting time across one order. Enter observed times before addressing delays.
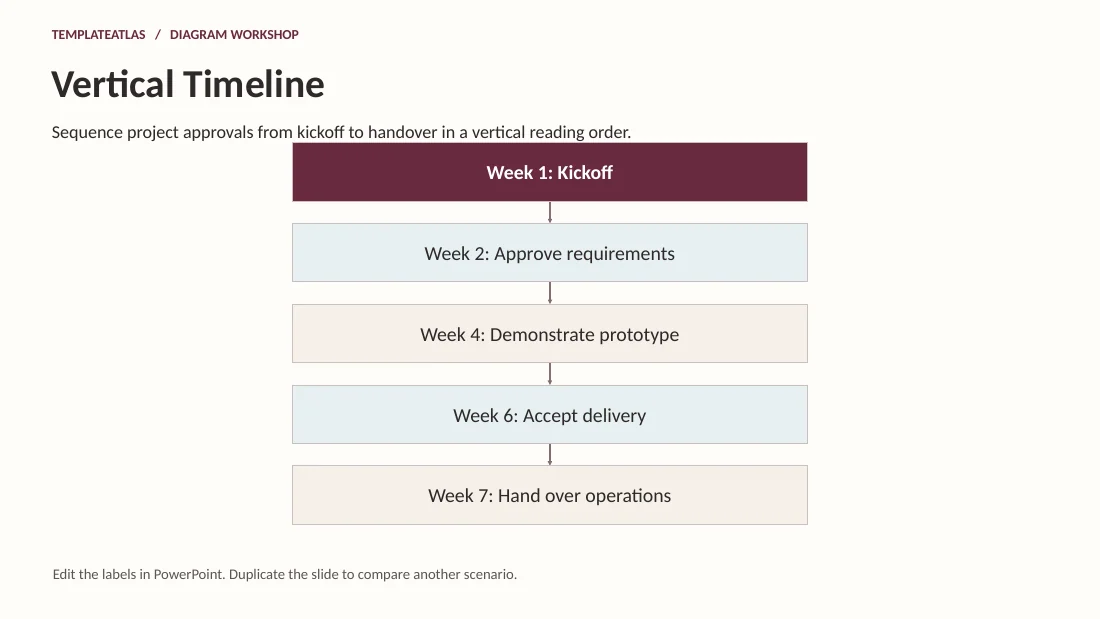
Vertical Timeline
Sequence project approvals from kickoff to handover in a vertical reading order.
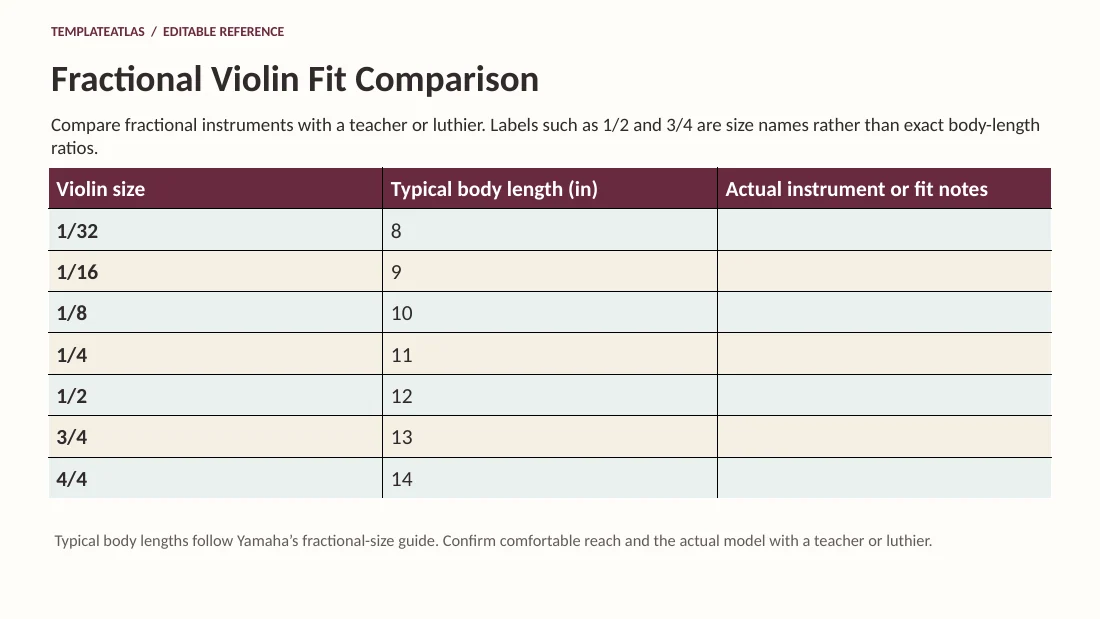
Fractional Violin Fit Comparison
Compare fractional instruments with a teacher or luthier. Labels such as 1/2 and 3/4 are size names rather than exact body-length ratios.
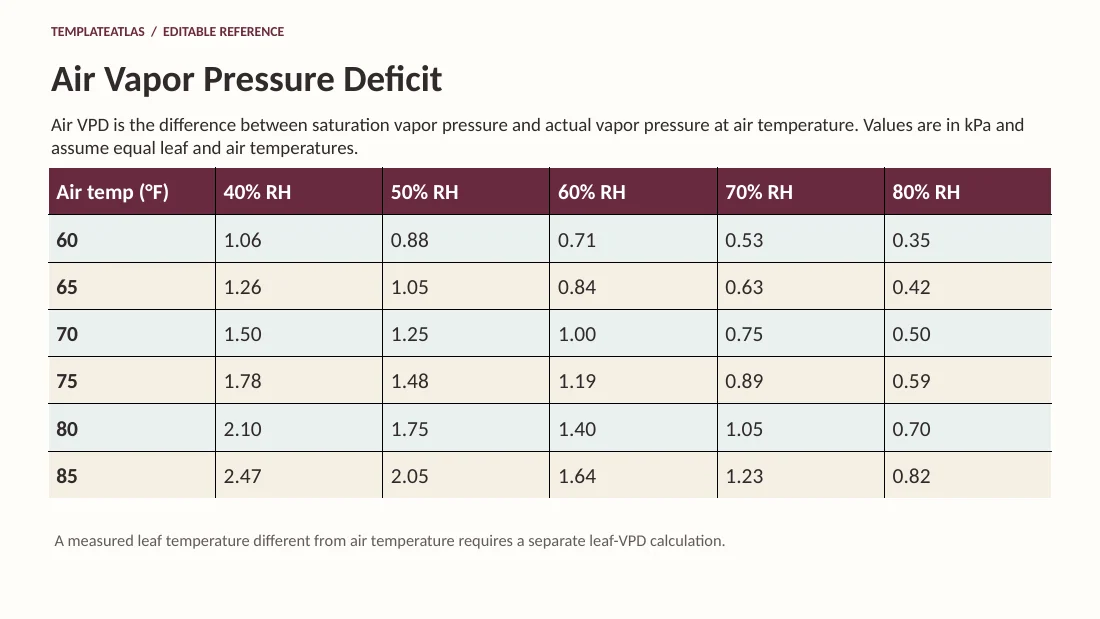
Air Vapor Pressure Deficit
Air VPD is the difference between saturation vapor pressure and actual vapor pressure at air temperature. Values are in kPa and assume equal leaf and air temperatures.
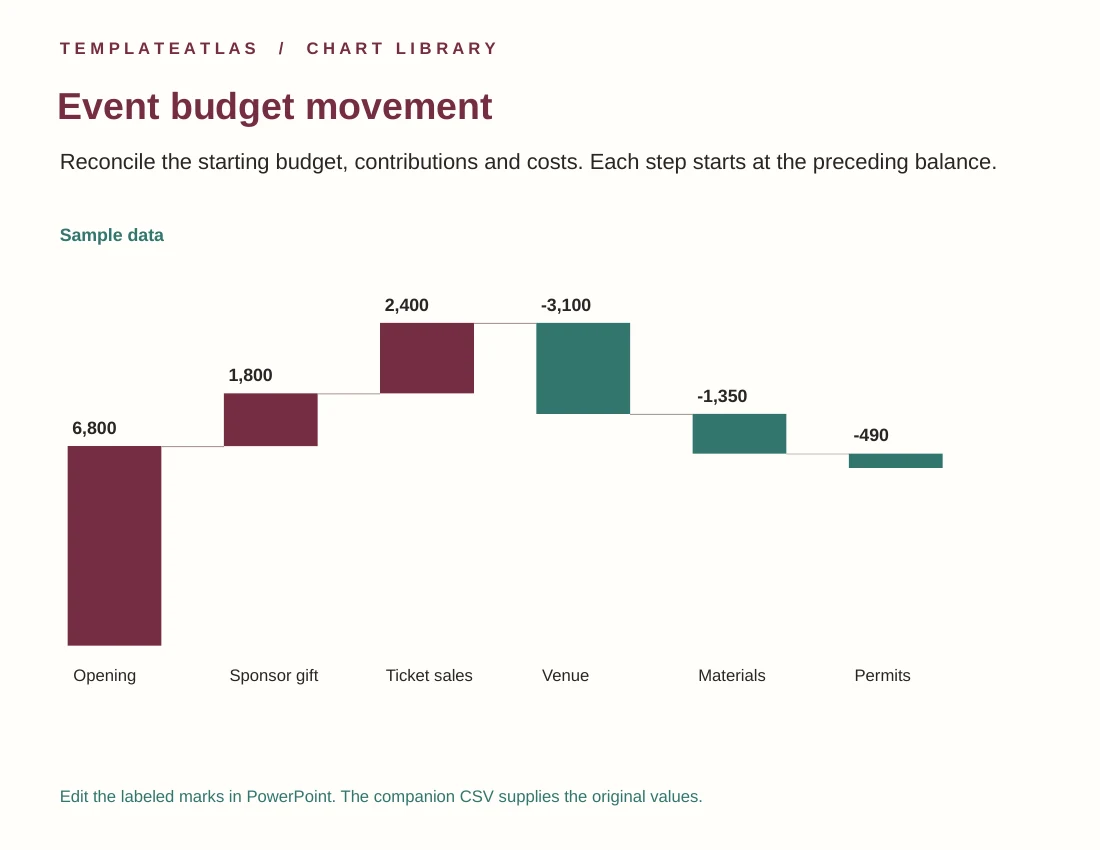
Event budget movement
Reconcile the starting budget, contributions and costs. Each step starts at the preceding balance.
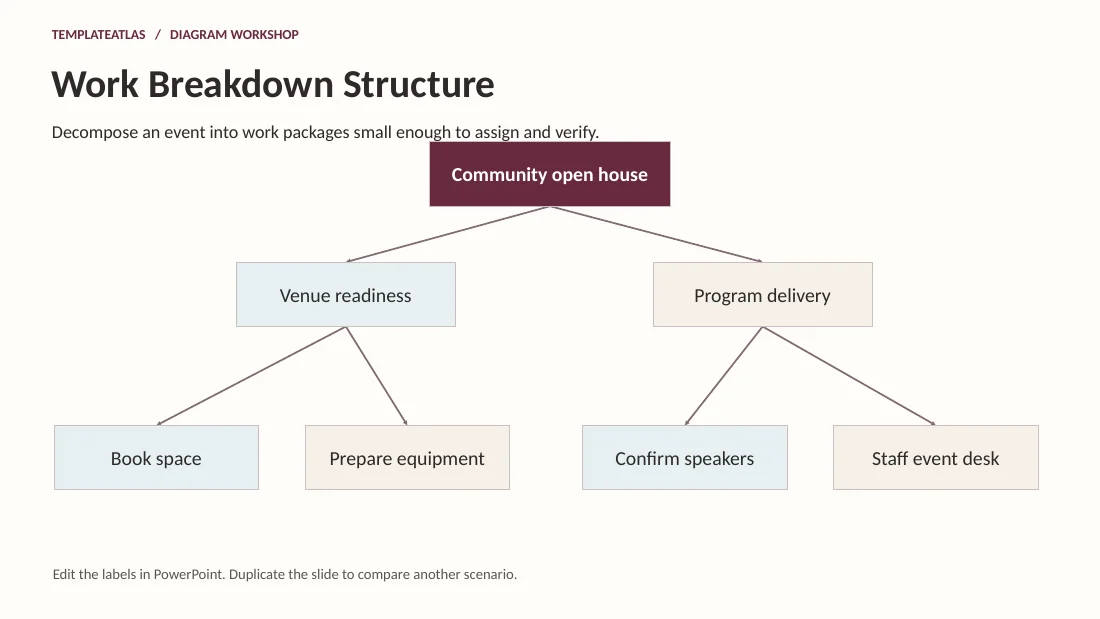
Work Breakdown Structure
Decompose an event into work packages small enough to assign and verify.
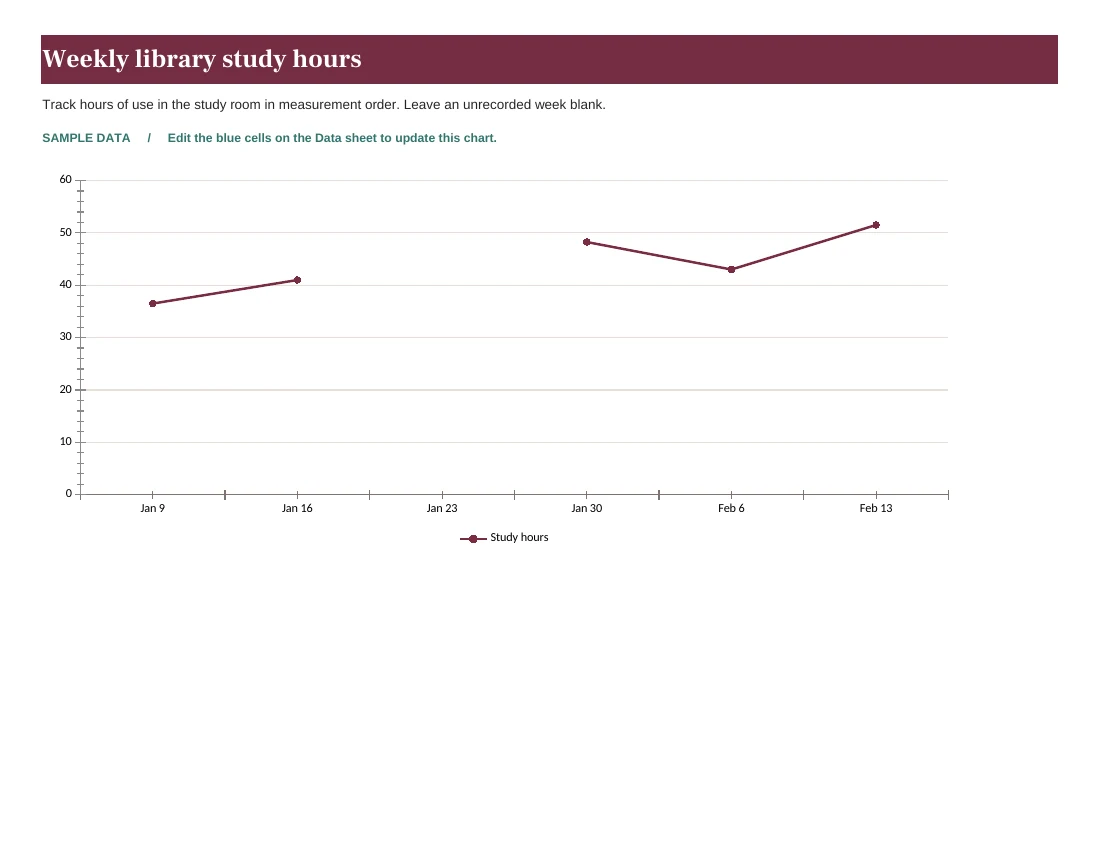
Weekly library study hours
Track hours of use in the study room in measurement order. Leave an unrecorded week blank.
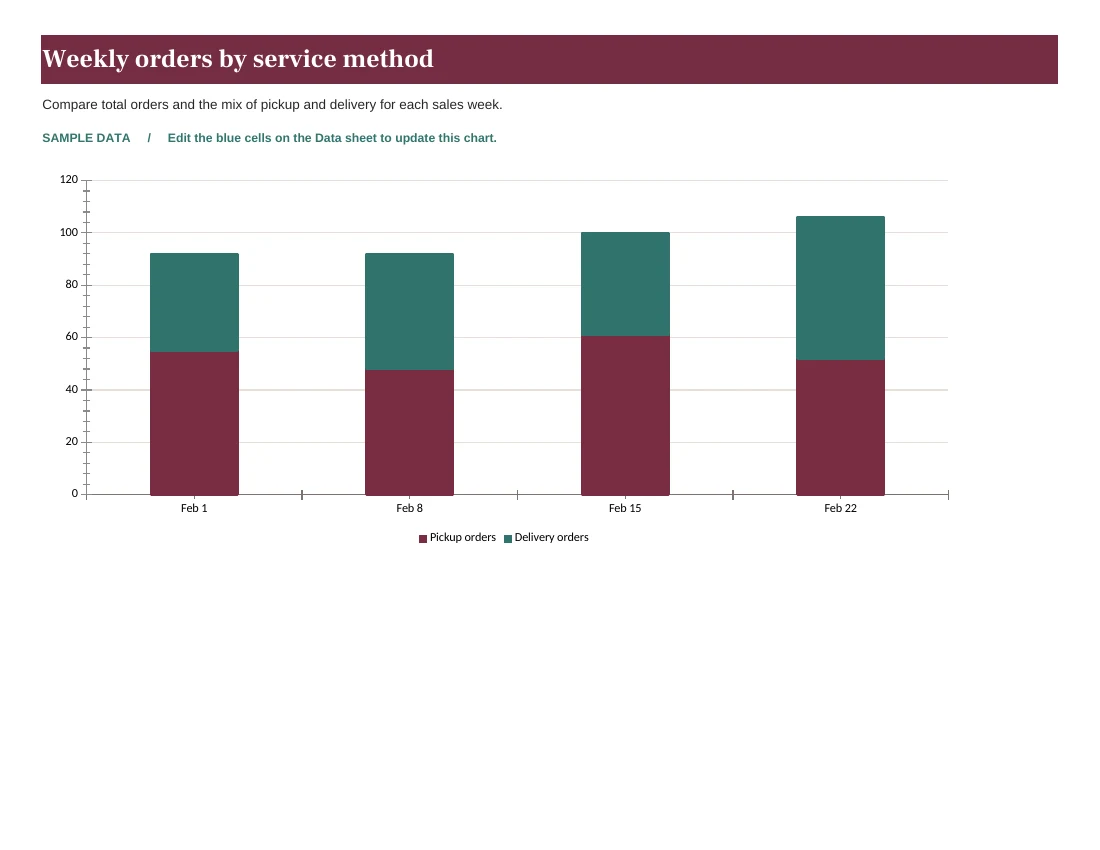
Weekly orders by service method
Compare total orders and the mix of pickup and delivery for each sales week.
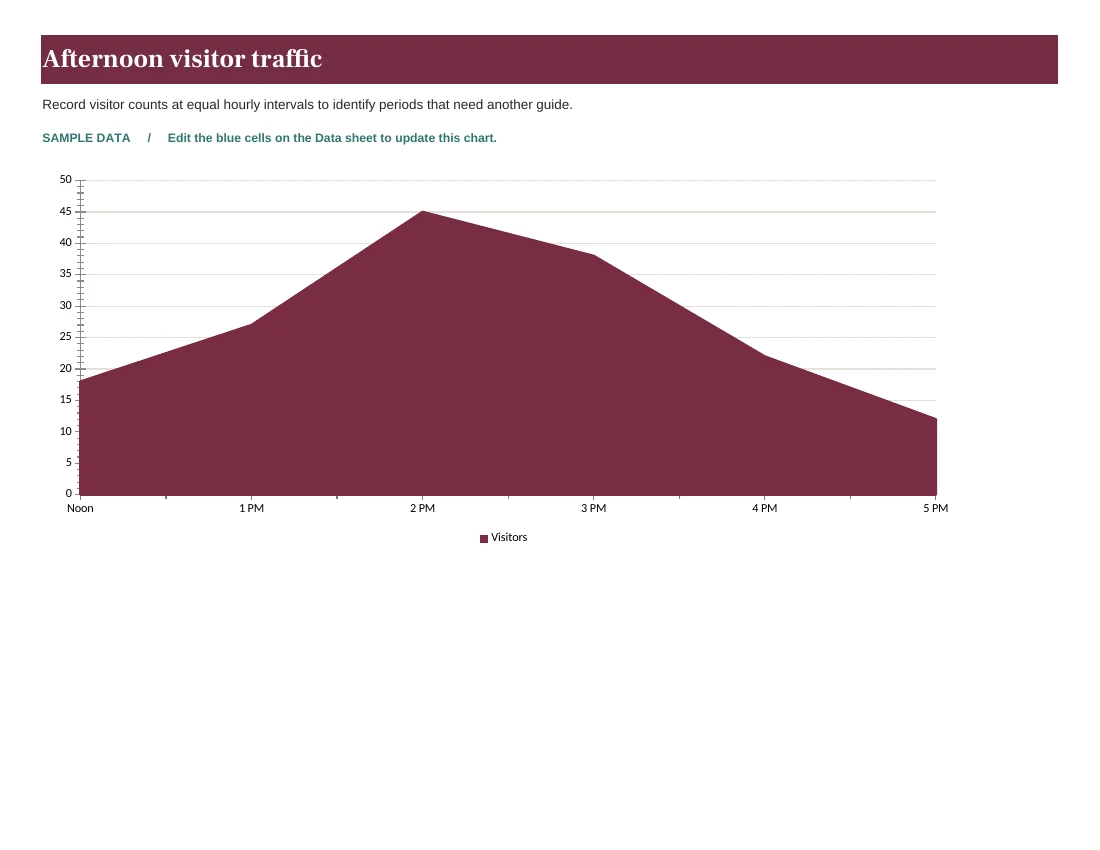
Afternoon visitor traffic
Record visitor counts at equal hourly intervals to identify periods that need another guide.
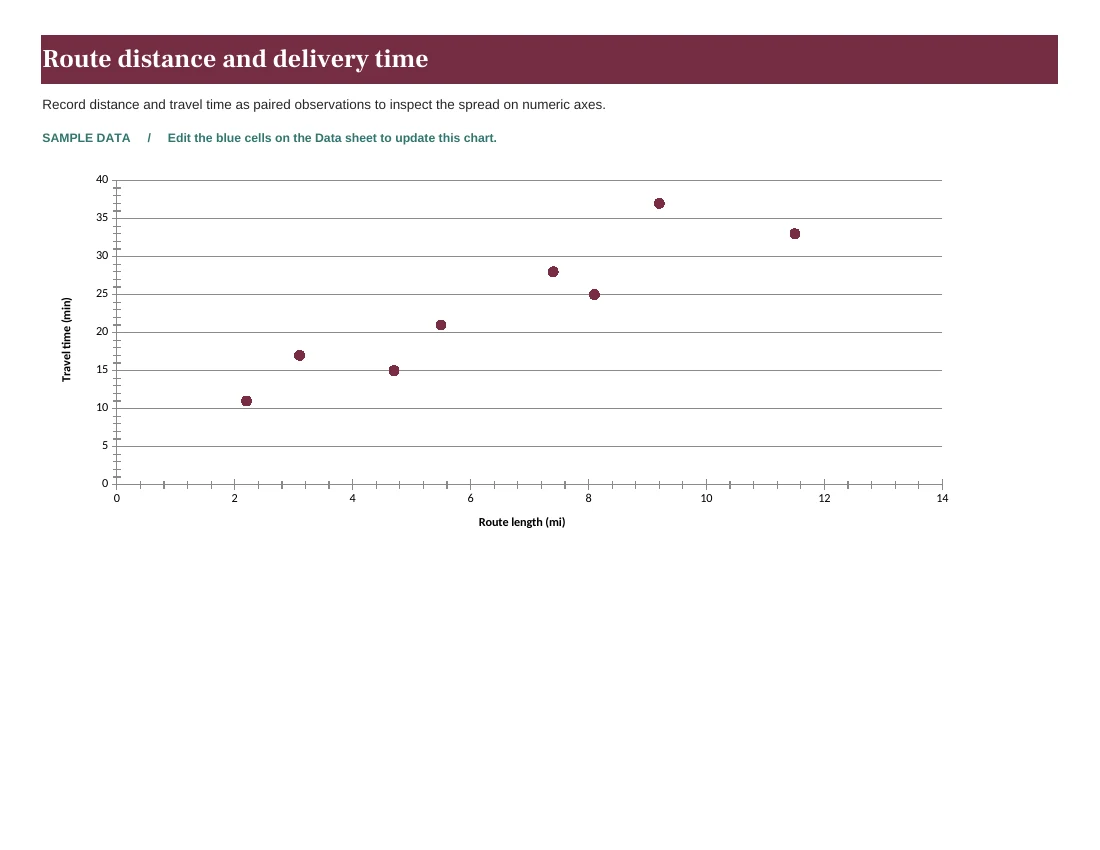
Route distance and delivery time
Record distance and travel time as paired observations to inspect the spread on numeric axes.
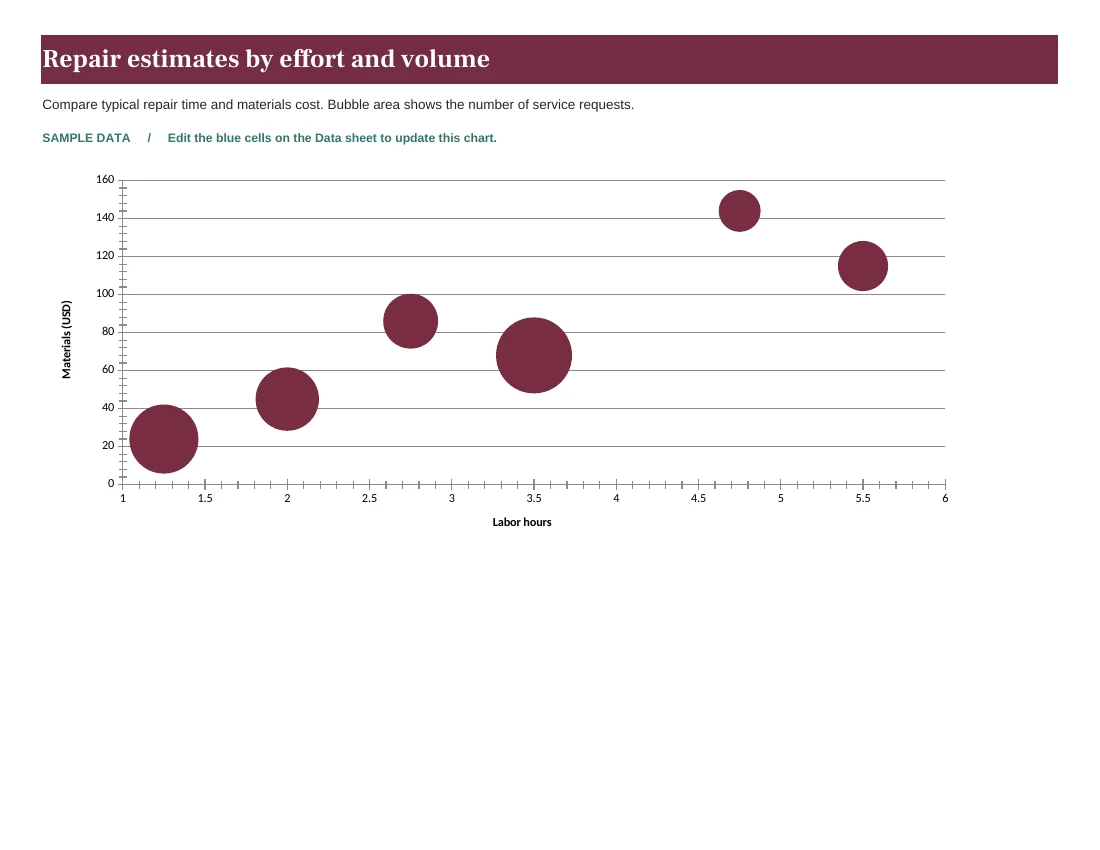
Repair estimates by effort and volume
Compare typical repair time and materials cost. Bubble area shows the number of service requests.
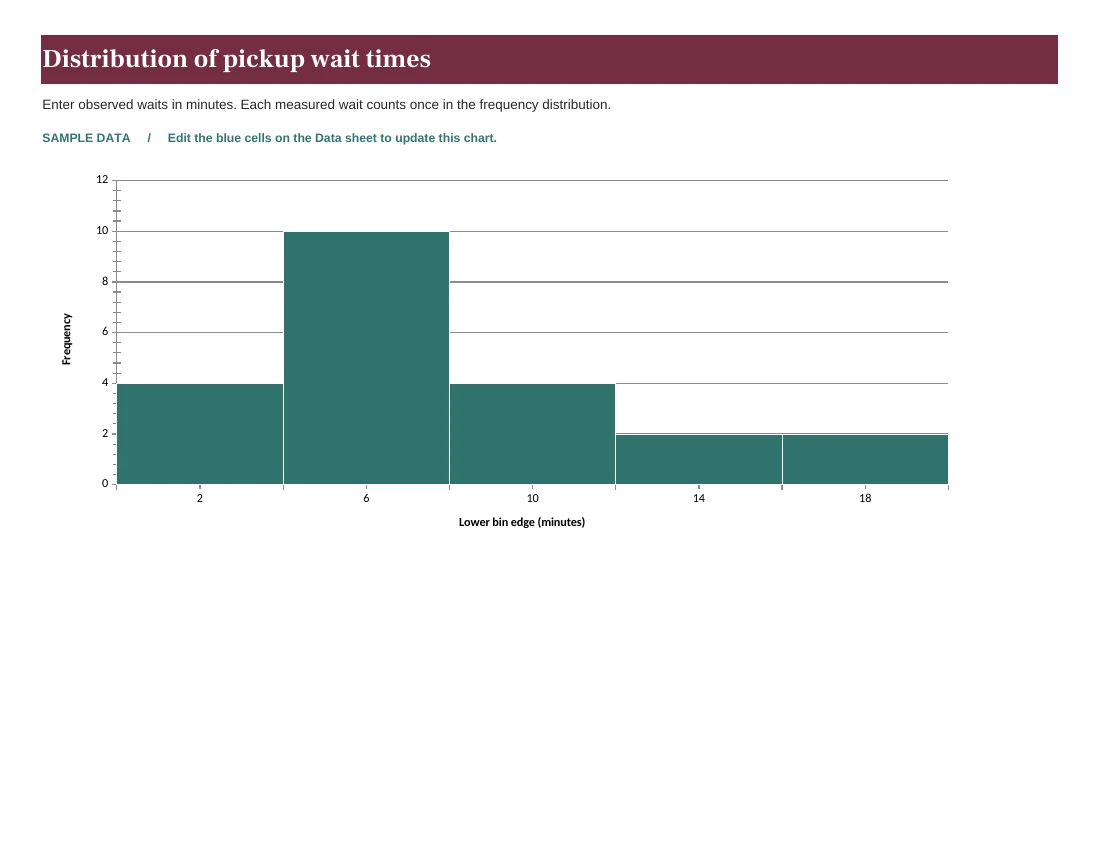
Distribution of pickup wait times
Enter observed waits in minutes. Each measured wait counts once in the frequency distribution.
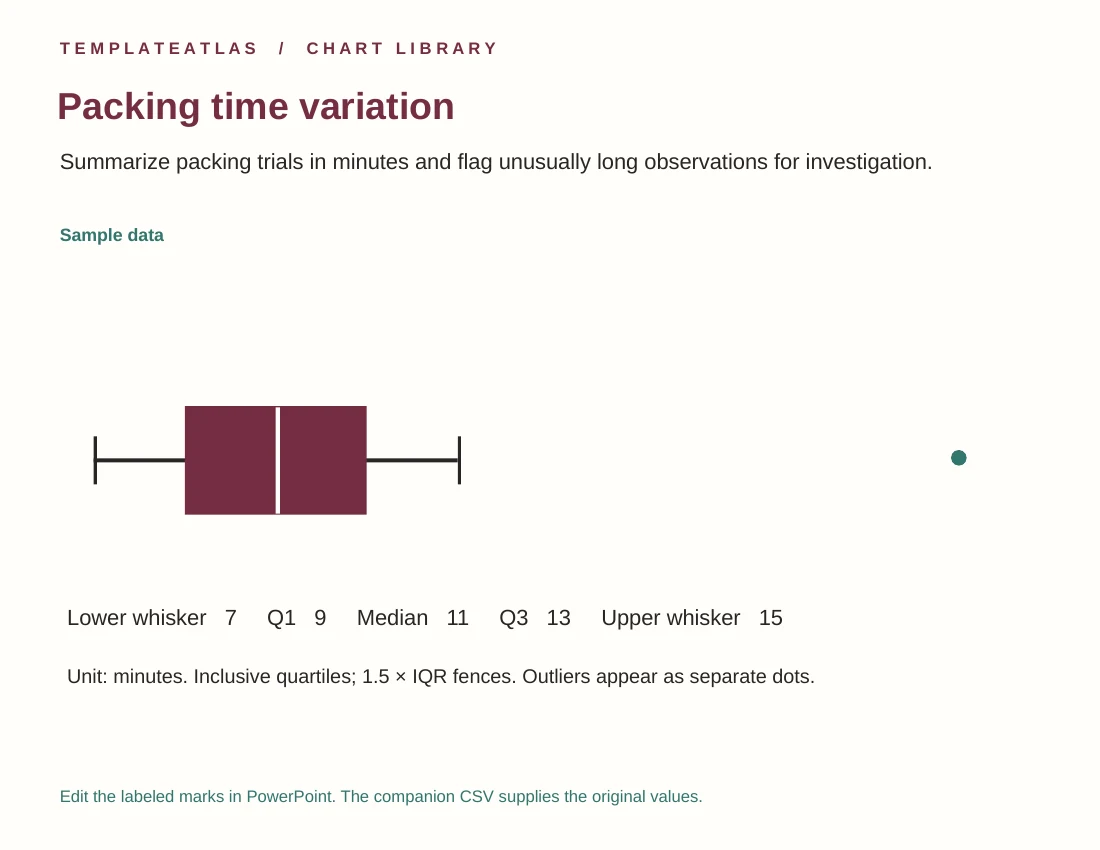
Packing time variation
Summarize packing trials in minutes and flag unusually long observations for investigation.
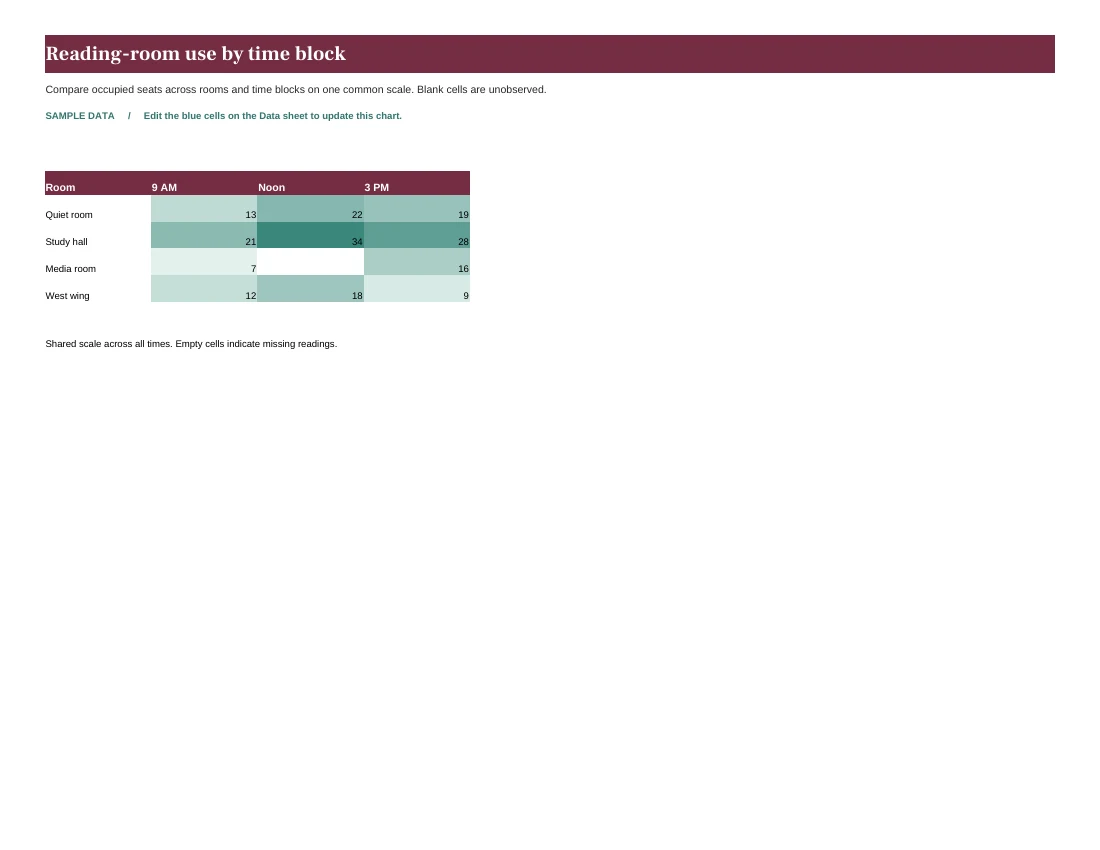
Reading-room use by time block
Compare occupied seats across rooms and time blocks on one common scale. Blank cells are unobserved.
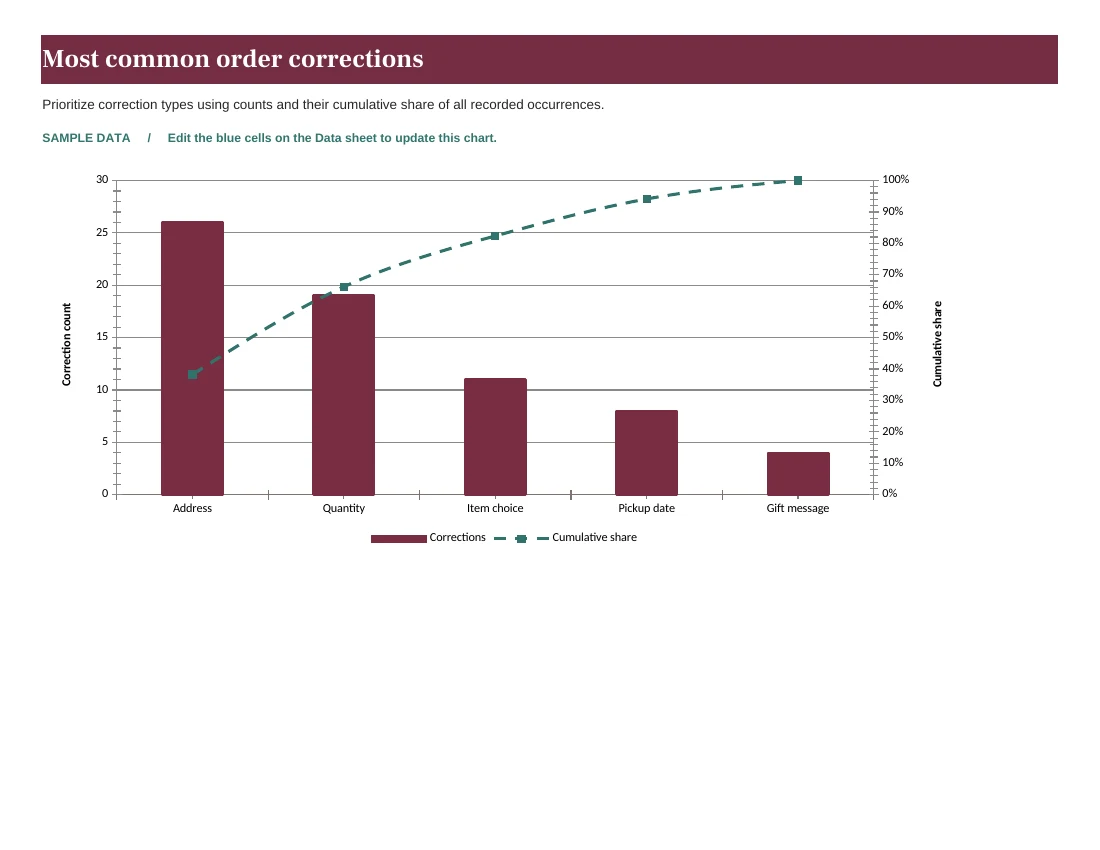
Most common order corrections
Prioritize correction types using counts and their cumulative share of all recorded occurrences.
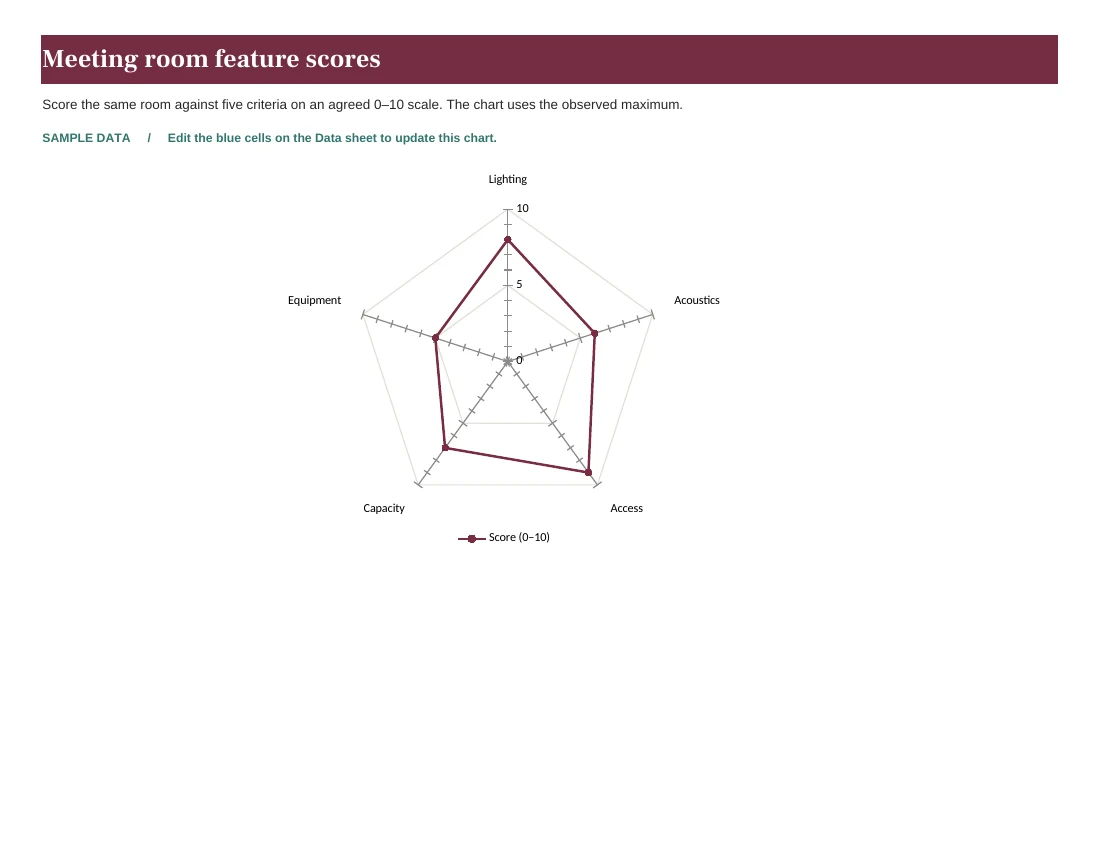
Meeting room feature scores
Score the same room against five criteria on an agreed 0–10 scale. The chart uses the observed maximum.
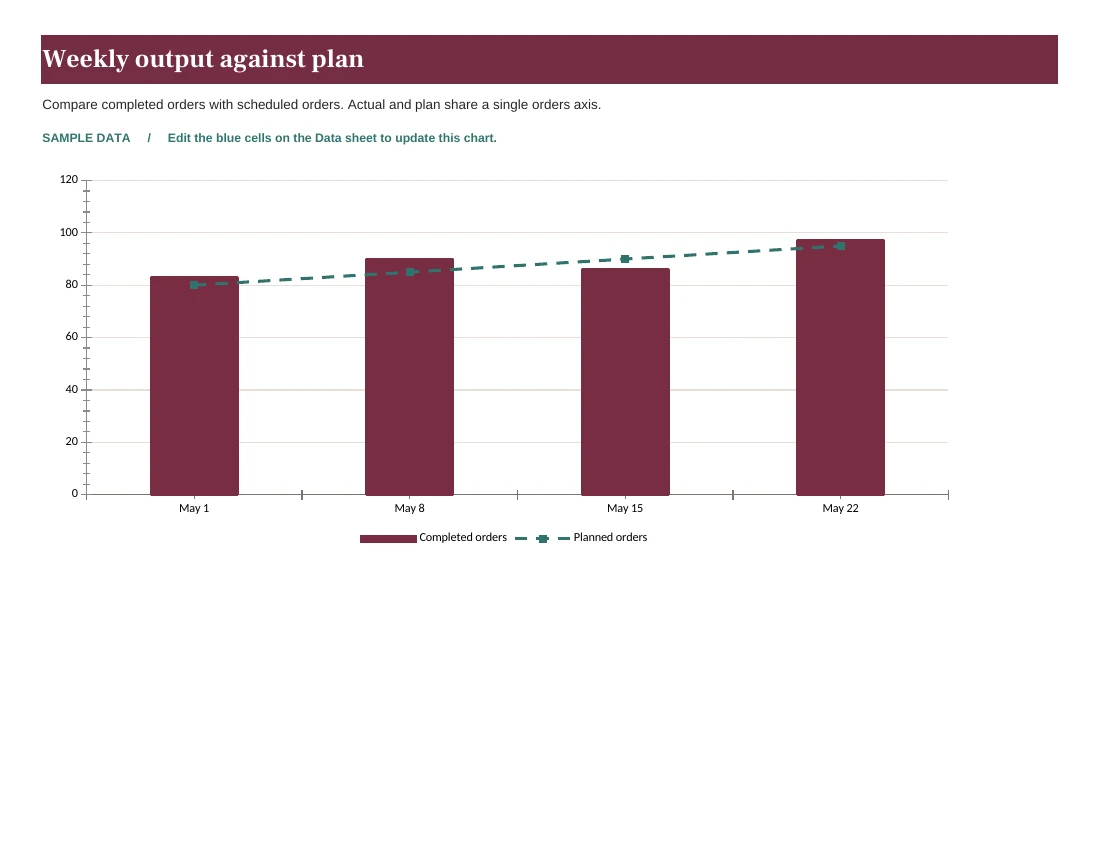
Weekly output against plan
Compare completed orders with scheduled orders. Actual and plan share a single orders axis.
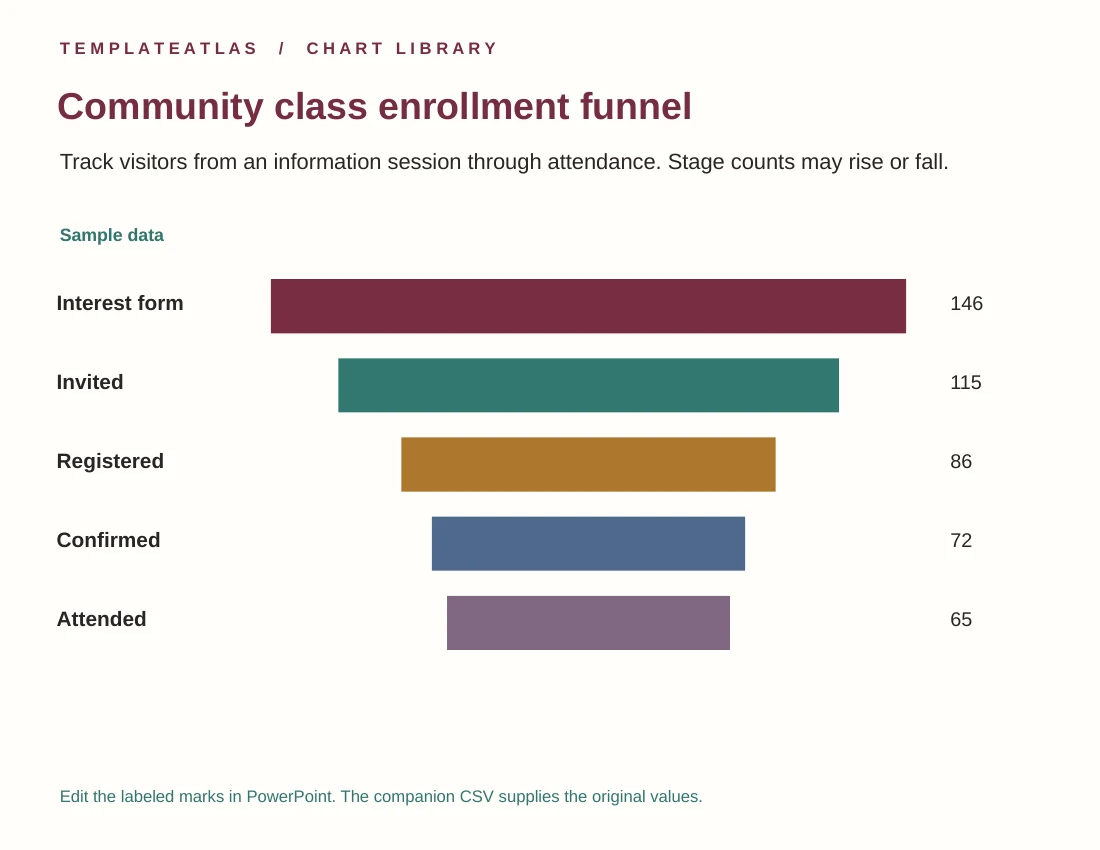
Community class enrollment funnel
Track visitors from an information session through attendance. Stage counts may rise or fall.
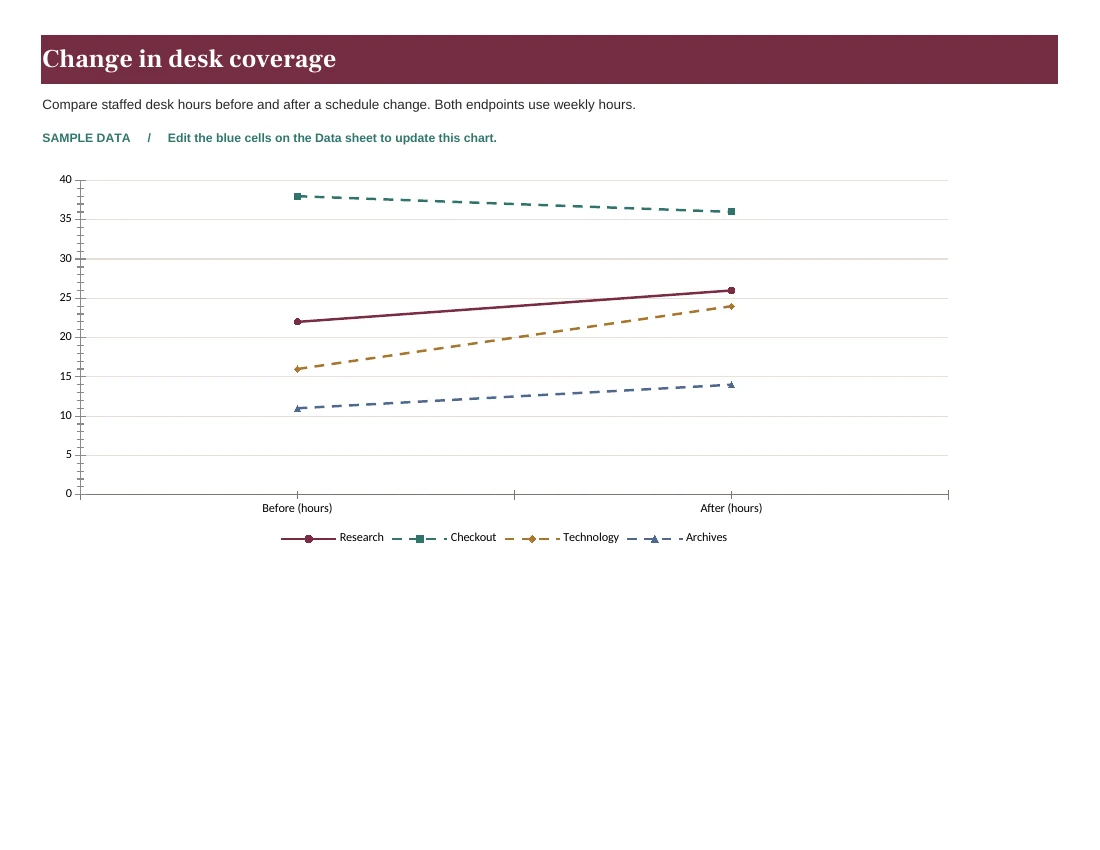
Change in desk coverage
Compare staffed desk hours before and after a schedule change. Both endpoints use weekly hours.